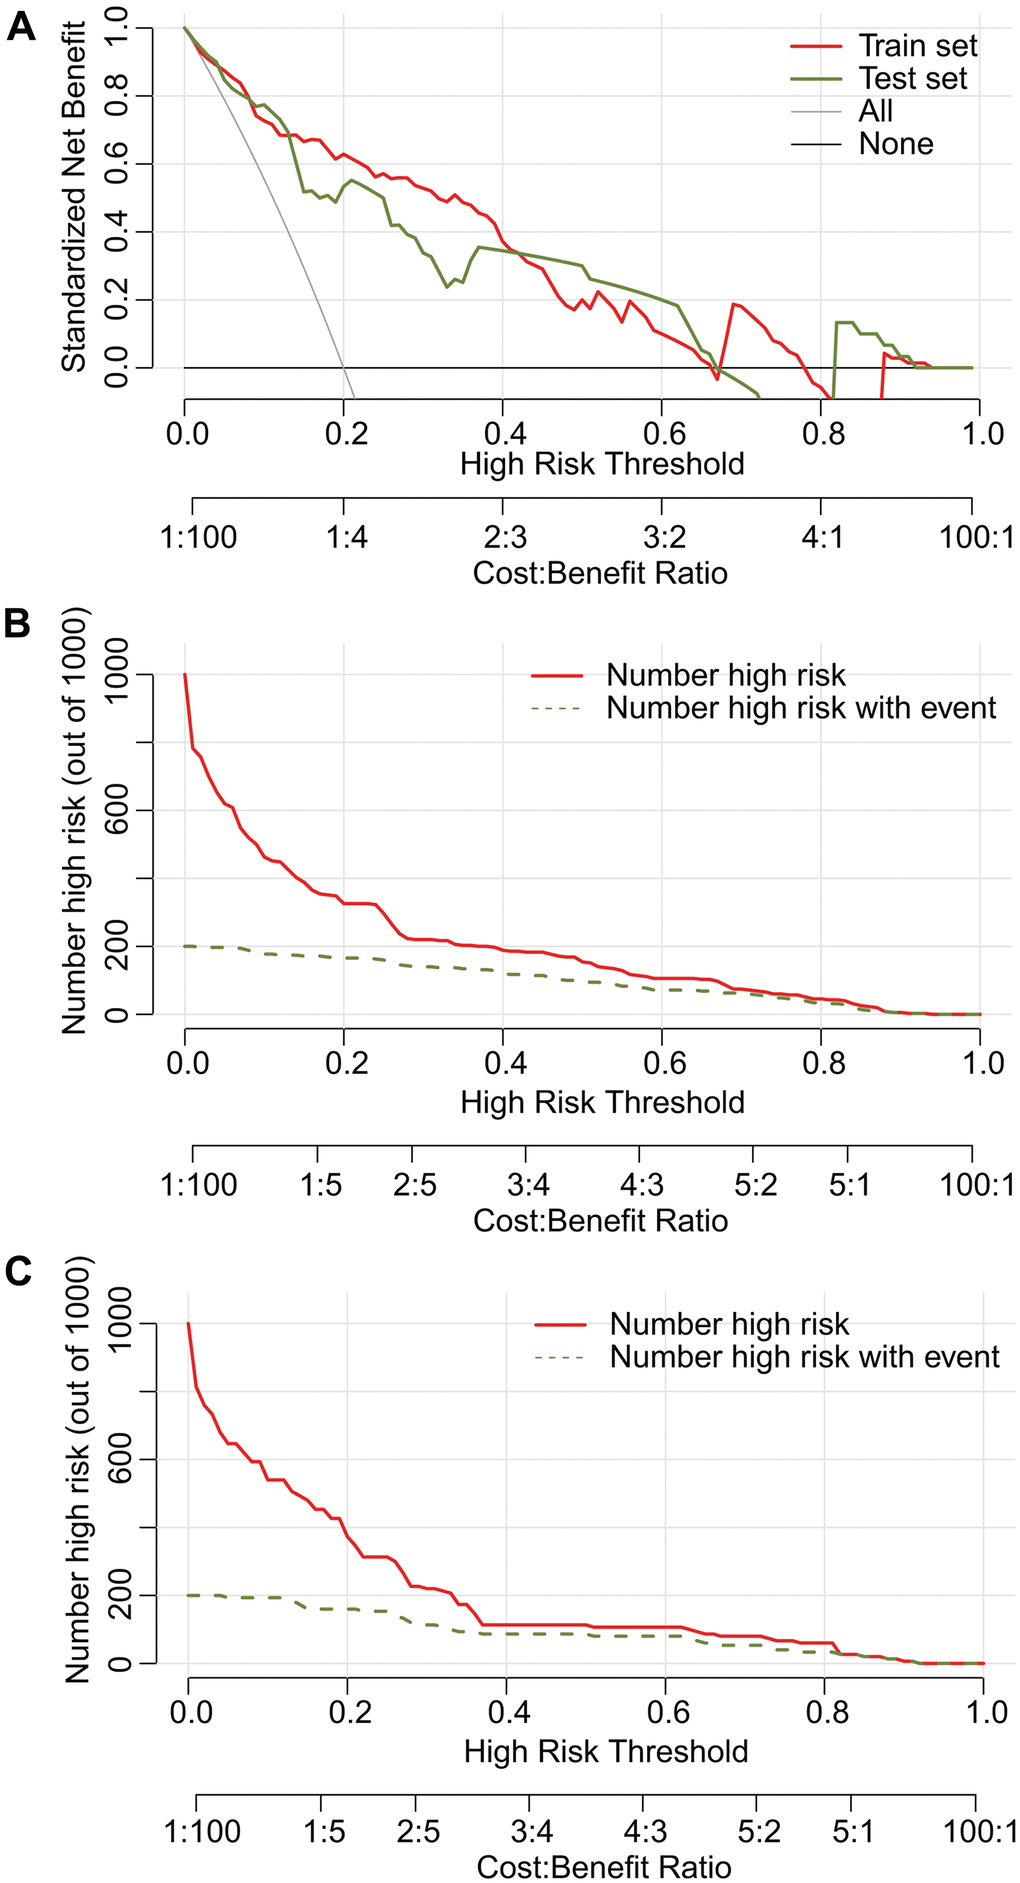
Figure 7.Decision curve analysis (DCA) and clinical impact plot of the nomograms for DME in both the training and test sets. The net benefit is greater than that achieved with an all-or-none patient intervention scheme if the threshold probability is less than 60% (A). Predictive high-risk estimates were similar to the actual number of event cases when the threshold probability was > 0.3 in both the training (B) and test set (C).