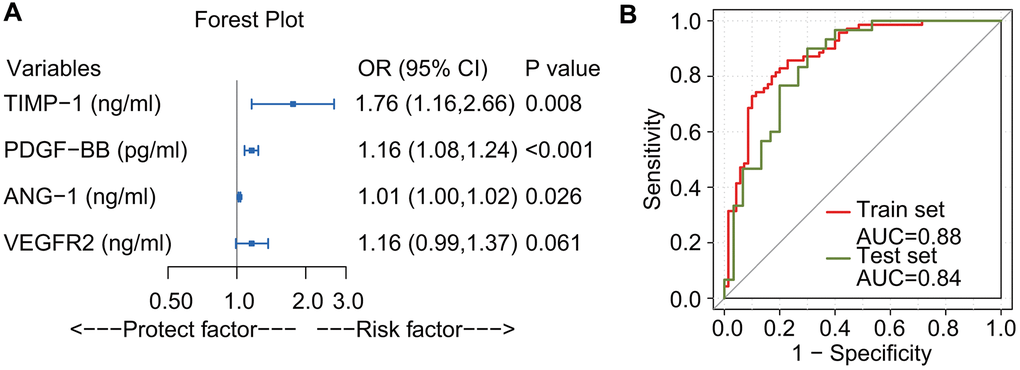
Figure 5.Forest plot and receiver operating characteristic curve of logistic regression. ANG-1, PDGF-BB, and TIMP-1 were identified as risk factors. VEGFR2 did not reach statistical significance, (p-value slightly larger than 0.05). Because the Akaike Information Criterion increased from 129.65 to 131.32 when removing VEGFR2 from the model, it was retained (A). Receiver operating characteristic curve for the prediction model. The area under the receiver operating characteristic curve of the training set (red line) and the test set (olive drab line) were 0.88 and 0.84, respectively (B).