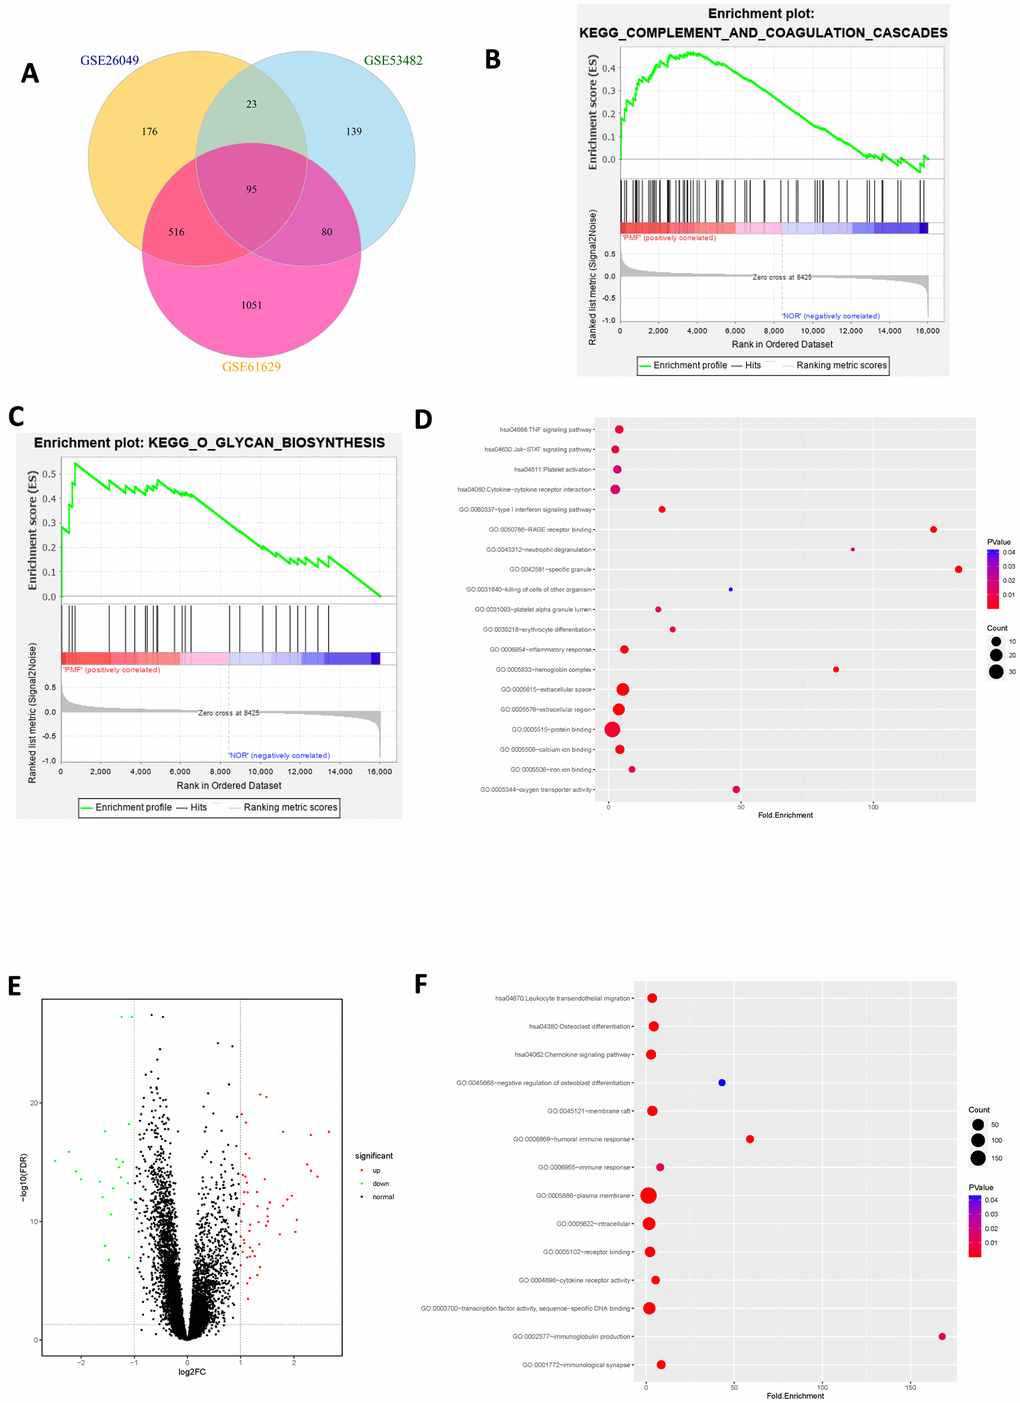
Figure 4.(A) Venn plot of differentially expressed genes among 3 datasets. (B) Gene set enrichment analysis of mutual DEGs among 3 datasets. (C) Gene set enrichment analysis of mutual DEGs among 3 datasets. (D) Bubble chart of functional and pathway enrichment analysis of up-regulated genes. (E) Volcano plot of differentially expressed genes among 3 datasets. Red represented up-regulated genes, green represented down-regulated genes and black represented normal genes. (F) Bubble chart of functional and pathway enrichment analysis of down-regulated genes.