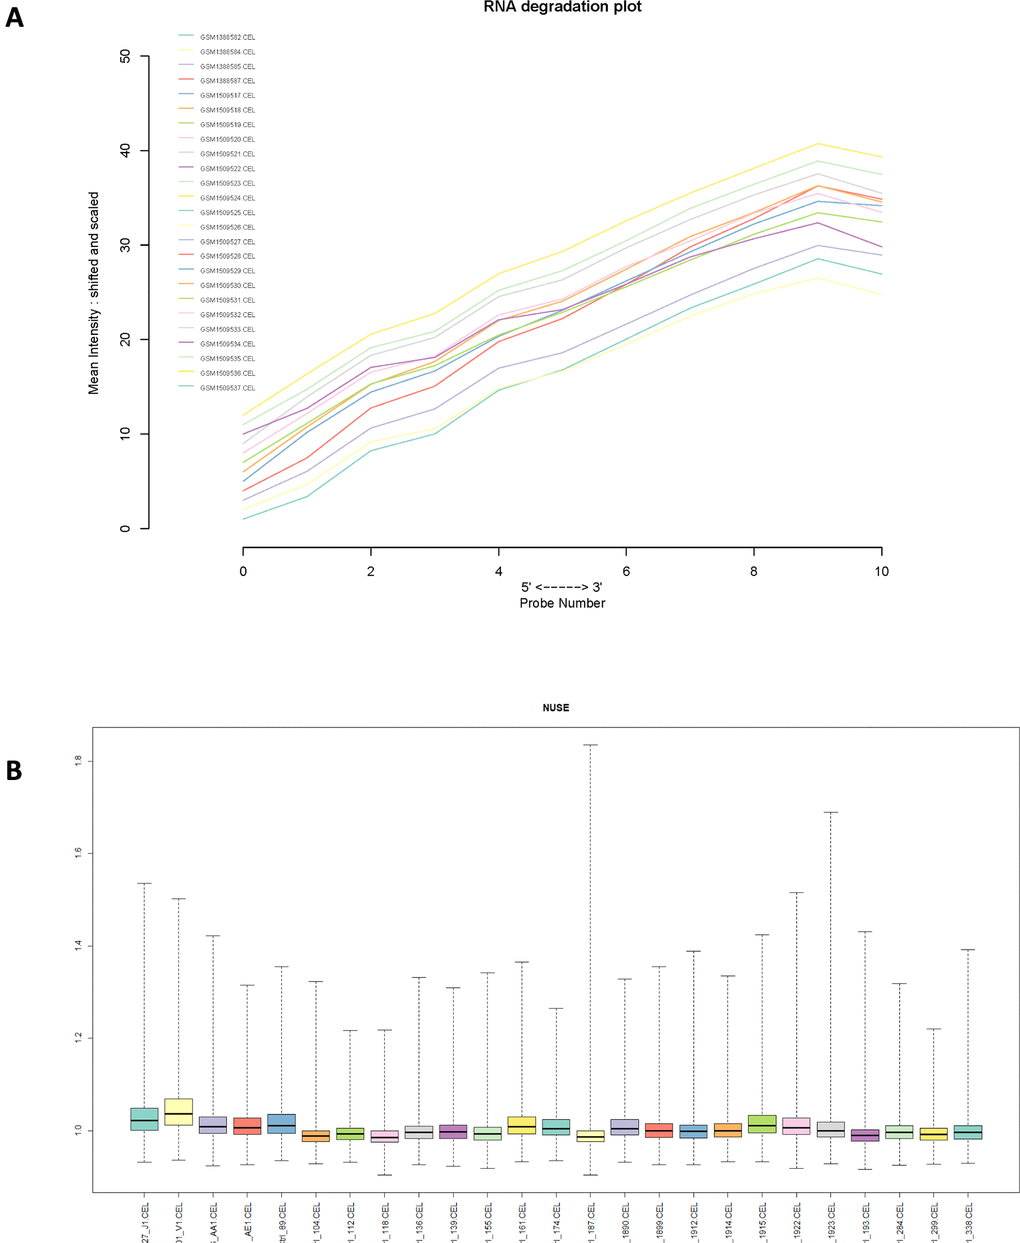
Figure 2.(A) RNA degradation plot of GSE61629 and (B) Box plot of normalized unscaled standard errors (NUSE) of GSE61629, which were used for quality control.
Figure 2 — Transcriptome profiling reveals target in primary myelofibrosis together with structural biology study on novel natural inhibitors regarding JAK2 | Aging