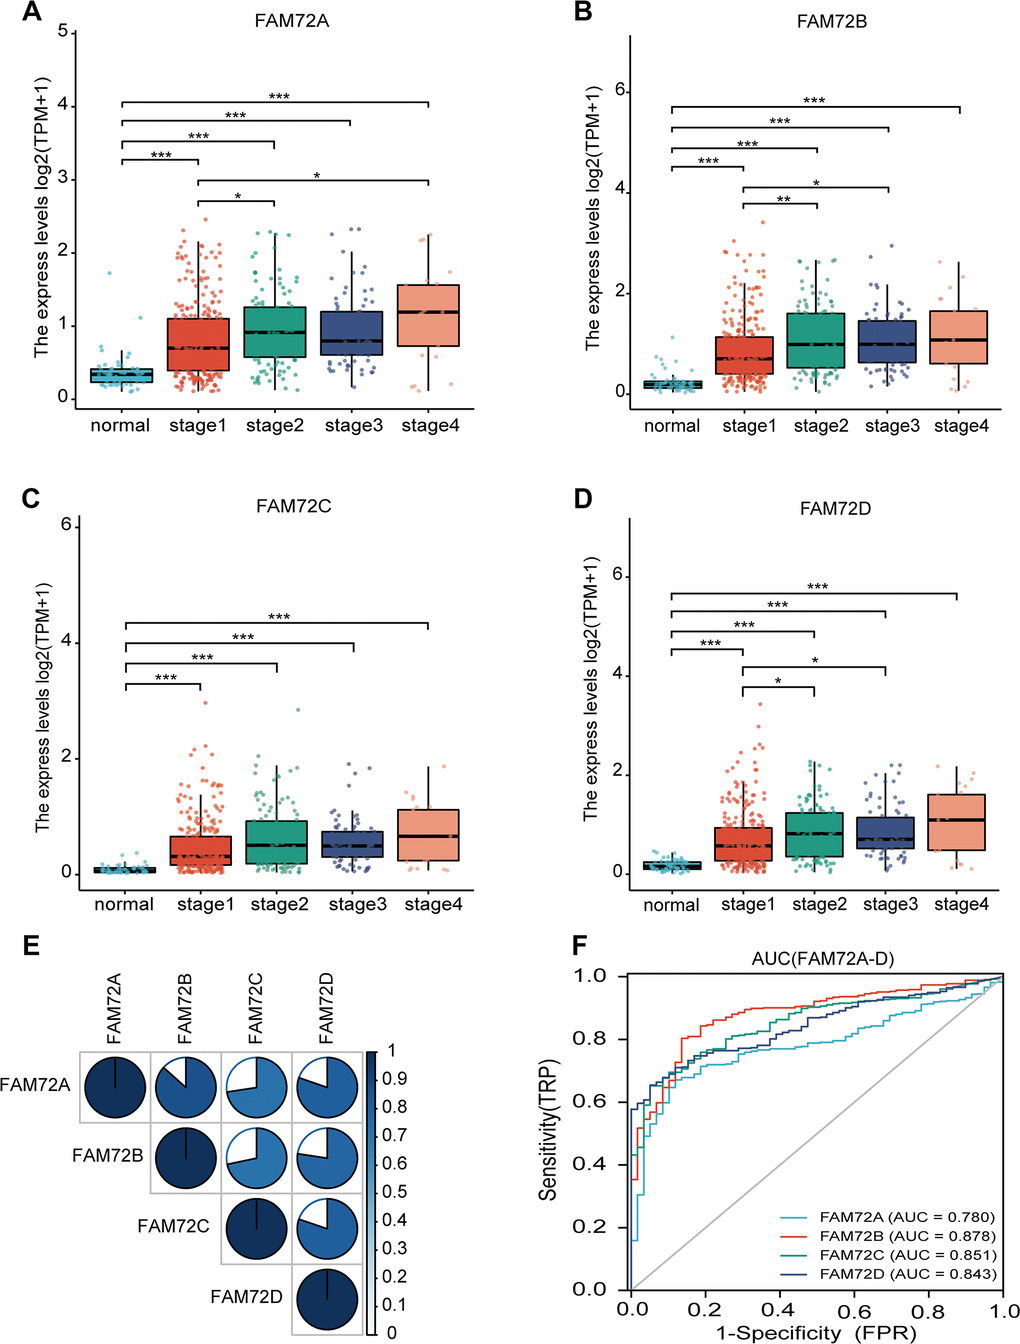
Figure 1.FAM72A-D expression levels in LUAD from TCGA data. (A–D) The expression levels of FAM72A-D in LUAD and normal tissue; (E) The correlation between FAM72A-D members; (F) Receiver operating characteristic analysis (ROC) of FAM72A-D in LUAD. (*P < 0.05, **P < 0.01, ***P < 0.001).