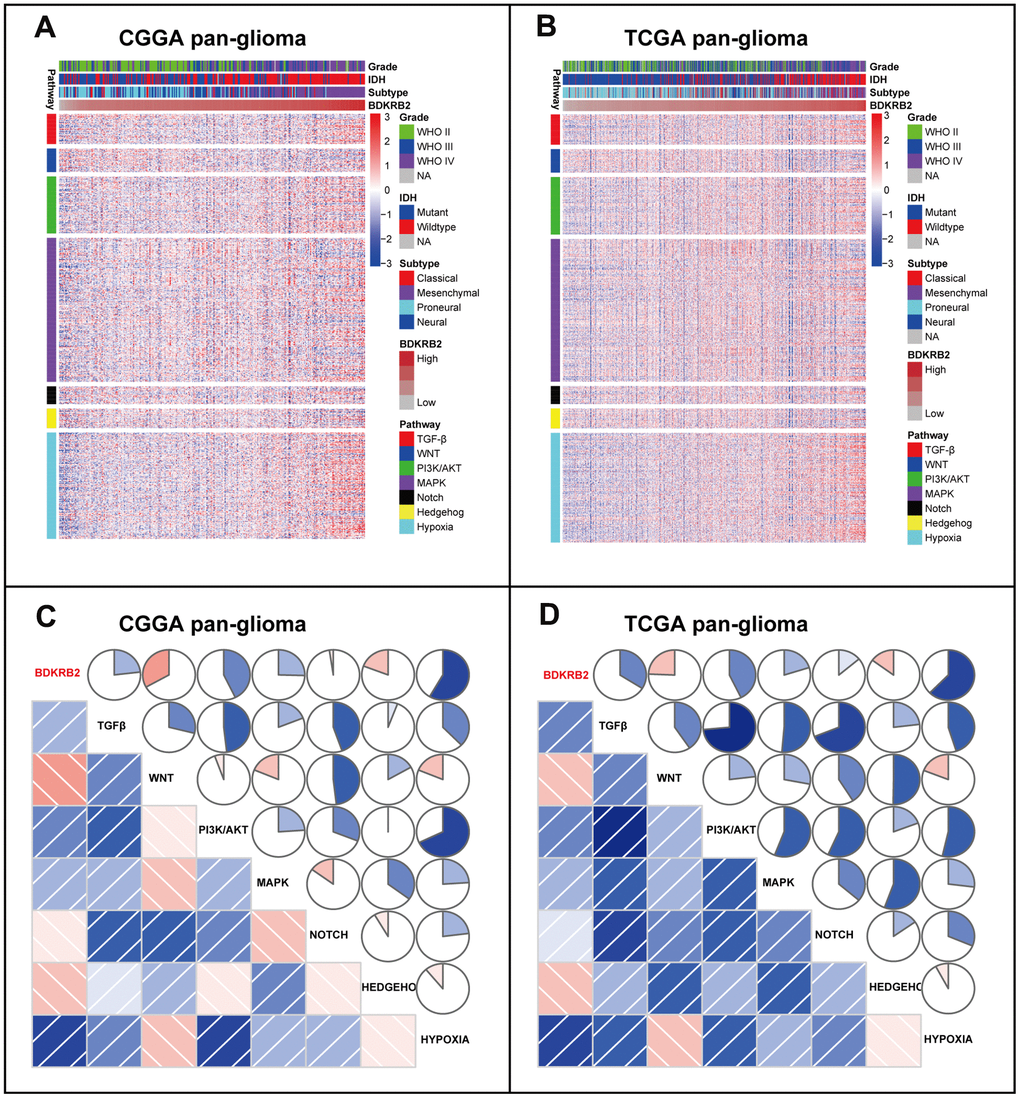
Figure 4.Cluster (A, B) and GSVA (C, D) of BDKRB2-related EMT signaling pathways in pan-glioma. In C and D, the blue and red colors represent positive and negative correlation, respectively. A darker color and a bigger sectorial area represent a higher correlation coefficient.