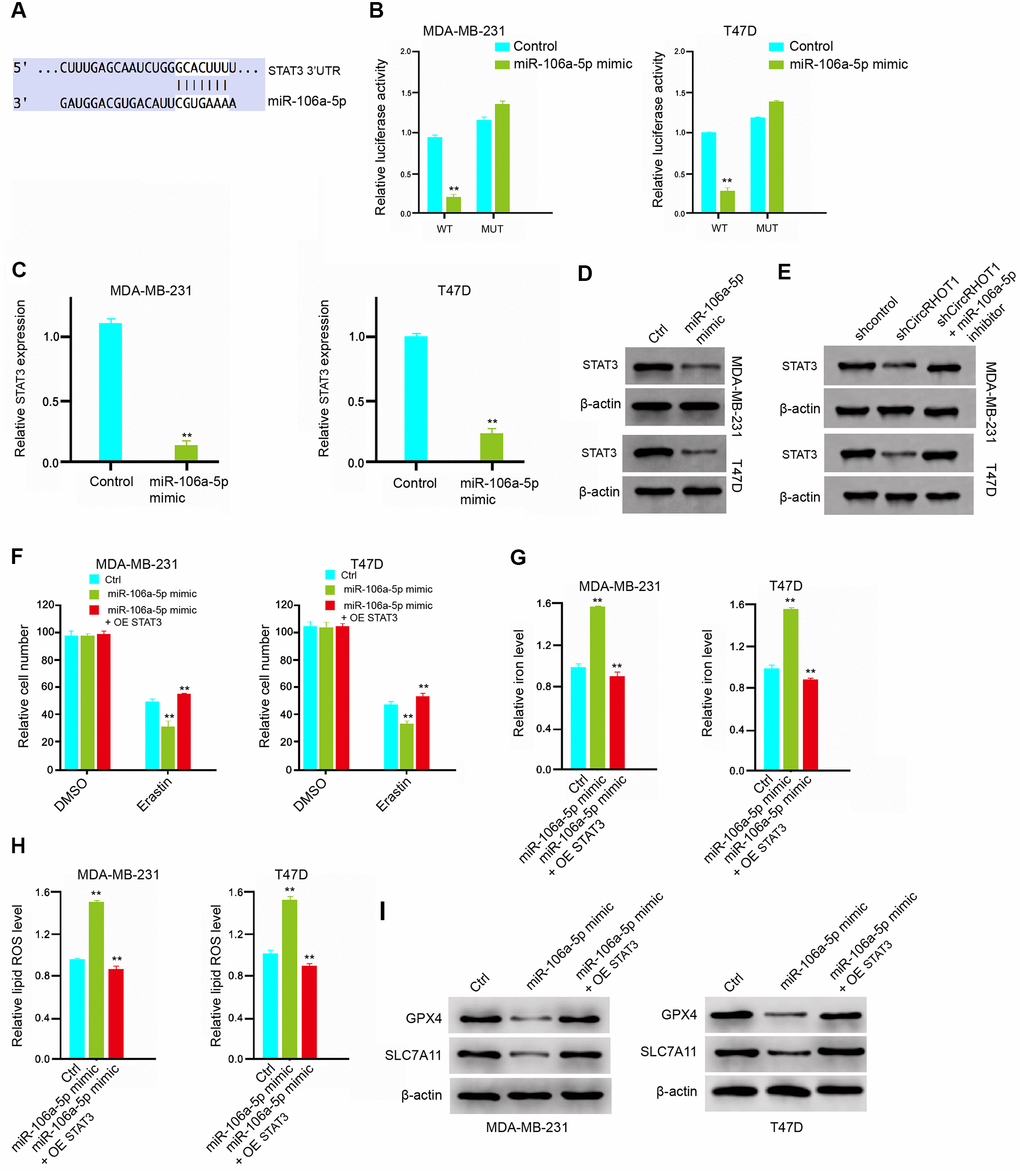
Figure 5.MiR-106a-5p induces ferroptosis by targeting STAT3 in breast cancer cells. (A) The interaction of miR-106a-5p and STAT3 3’ UTR was identified by bioinformatic analysis using Targetscan (http://www.targetscan.org/vert_72/). (B–D) The MDA-MB-231 and T47D cells were treated with the miR-106a-5p mimic or control mimic. (B) The luciferase activities of wild type STAT3 (STAT3 WT) and STAT3 with the miR-106a-5p-binding site mutant (STAT3 MUT) were determined by luciferase reporter gene assays in the cell. (C) The mRNA expression of STAT3 was analyzed by qPCR in the cells. (D) The protein expression of STAT3 and β-actin was tested by Western blot analysis in the cells. (E) The MDA-MB-231 and T47D cells were treated control shRNA, circRHOT1 shRNA, or co-treated with circRHOT1 shRNA and miR-106a-5p inhibitor. The protein expression of STAT3 and β-actin was assessed by Western blot analysis in the cells. (E, F) The MDA-MB-231 and T47D cells were treated with 5 mmol/L erastin, co-treated with 5 mmol/L erastin and miR-106a-5p mimic, or o-treated with 5 mmol/L erastin, miR-106a-5p mimic, and pcDNA.1-STAT3. The cell growth was analyzed by MTT assays. (G–I) The MDA-MB-231 and T47D cells were treated control shRNA, miR-106a-5p mimic, or co-treated with miR-106a-5p mimic and pcDNA.1-STAT3. (G) The levels of iron were analyzed by Iron Assay Kit. (H) The levels of ROS were measure by flow cytometry analysis in the cells. (I) The expression of GPX4, SLC7A11, and β-actin was measured by Western blot analysis in the cells. Data are presented as mean ± SD. Statistic significant differences were indicated: ** P < 0.01.