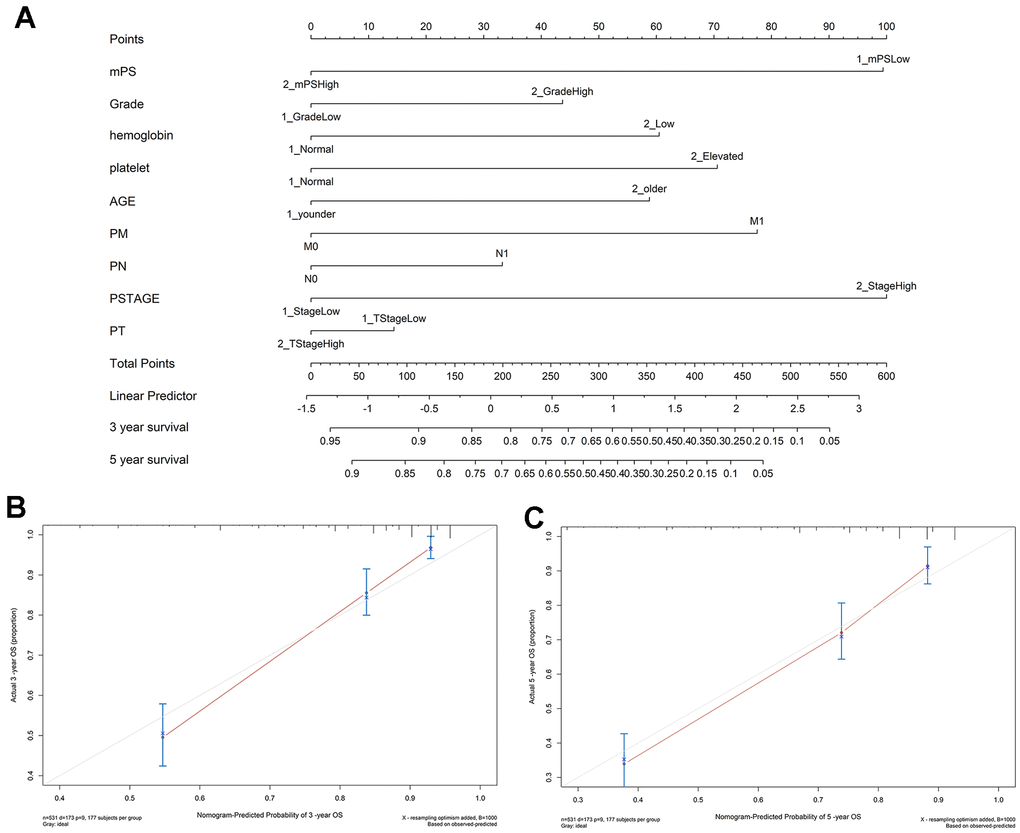
Figure 5.Nomogram construction results. (A) Nomogram to predict the 3- and 5-year OS for ccRCC patients in the TCGA cohort; (B, C) calibration curves for the nomogram model of the 3- and 5-year OS.
Figure 5 — Artificial intelligence prediction model for overall survival of clear cell renal cell carcinoma based on a 21-gene molecular prognostic score system | Aging