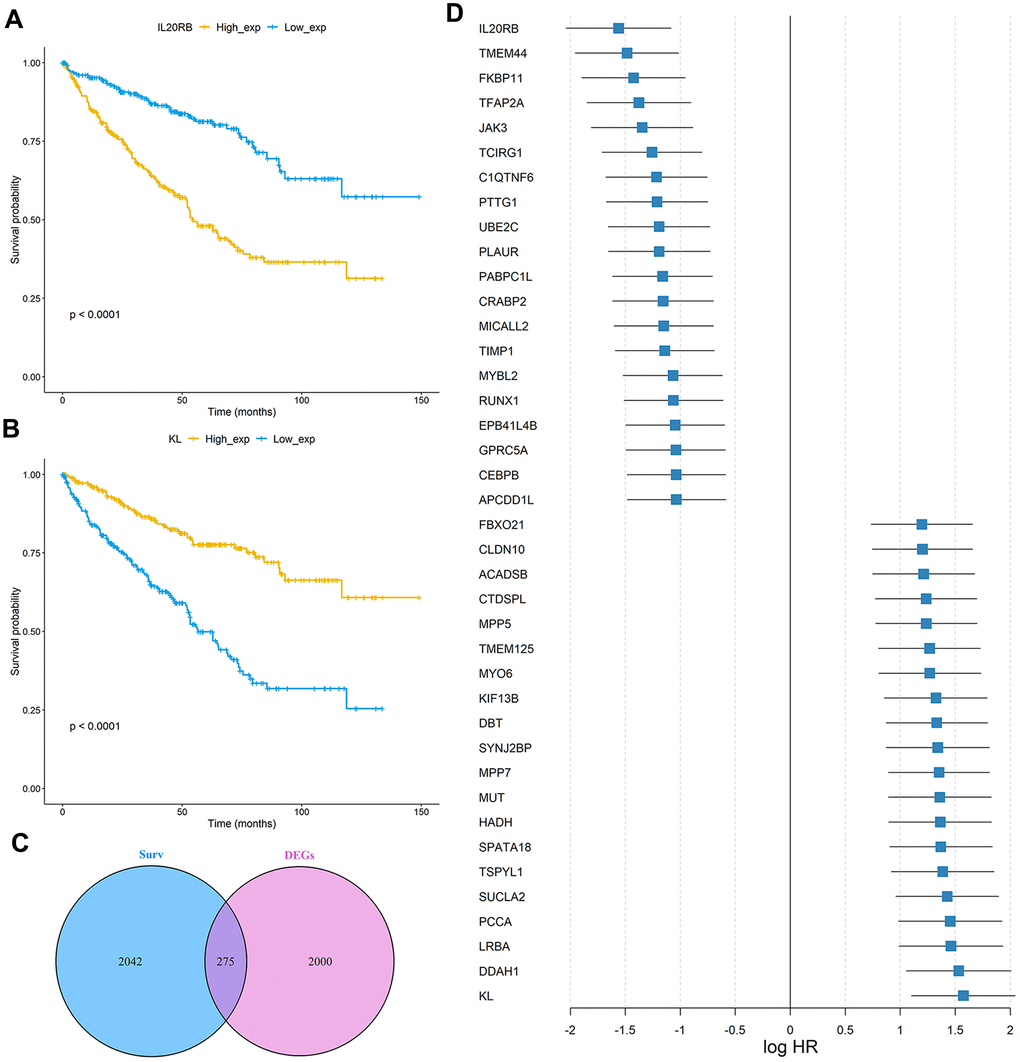
Figure 2.Identification of prognosis-related genes in the TCGA ccRCC cohort. (A, B) Kaplan-Meier curves of OS for the TCGA cohort based on IL20RB and KL expression levels, respectively; (C) Venn diagram of prognostic-related genes and differentially expressed genes in TCGA cohort; (D) The integrated HR for Top 40 prognosis-related genes in the TCGA data sets.