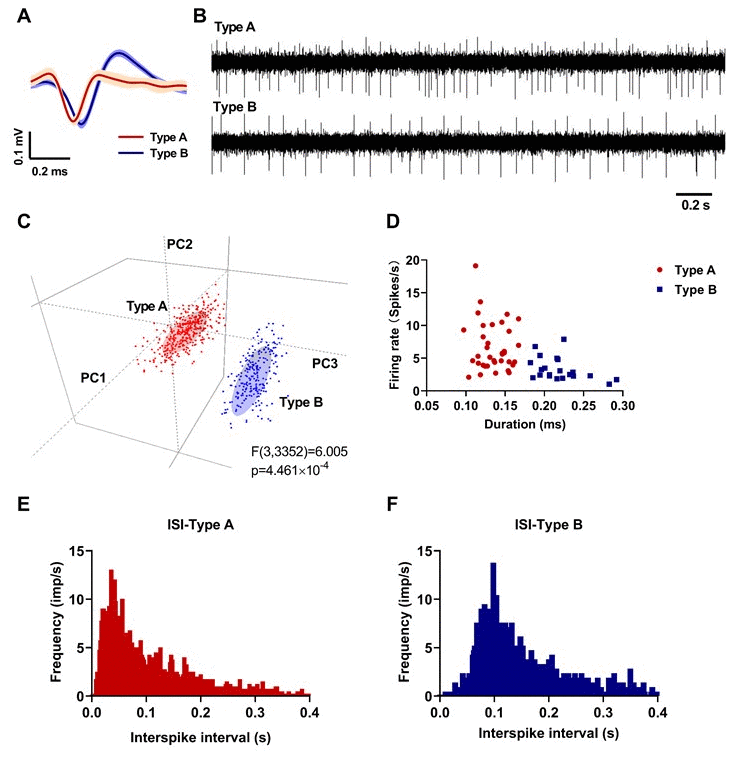
Figure 3.Neuronal classification results in the pedunculopontine nucleus (PPN) (red: Type A; blue: Type B). (A) Averaged waveforms of each neuronal type. (B) Representative signals of each neuronal type. (C) Principal component analysis (PCA) results in 3D view. (D) Spike duration (trough-to-peak) and firing rate of 36 Type A and 21 Type B neurones. (E) Representative inter-spike interval histogram of a Type A neurone. (F) Representative inter-spike interval histogram of a Type B neurone.