Submit an Article
Navigate
Home
Editorial Board
Editorial Policies
Current Volume
Archive
Scientific Integrity
Publication Ethics Statements
Interviews with Outstanding Authors
Newsroom
Sponsored Conferences
Podcast
Contact
Special Collections
Submit an Article
Online ISSN: 1945-4589
Research Paper
|
Volume 13, Issue 5
|
pp. 7228–7246
Evaluating the association between brain atrophy, hypometabolism, and cognitive decline in Alzheimer’s disease: a PET/MRI study
Back to article
Figure 4
(4 of 5)
−
100%
+
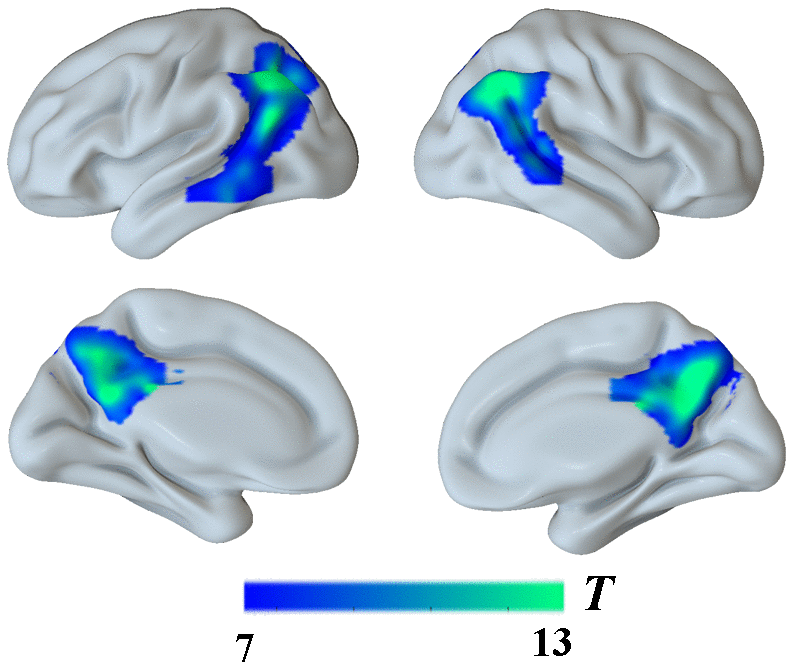
Figure 4.
Group differences in
18
F-FDG SUVR by using whole-brain confirmatory analysis between the AD group and the NC group.
Significant reduced metabolism in AD patients was shown in cold blues.