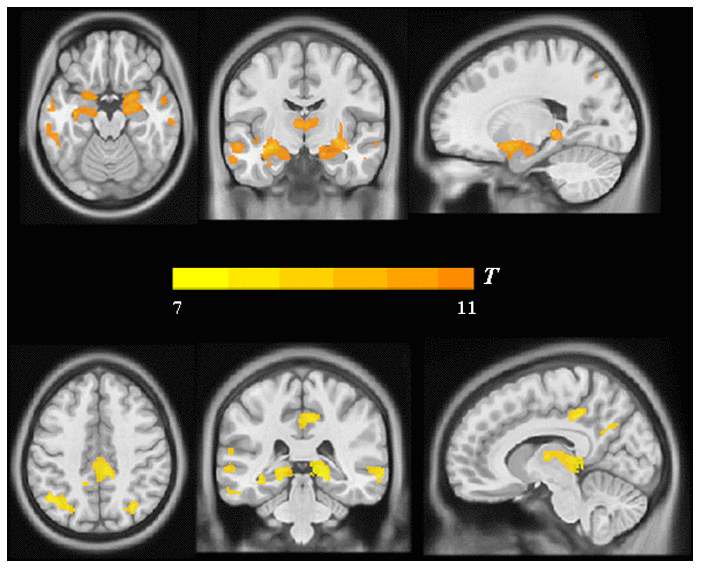
Figure 3.Group differences in VBM analysis between the AD group and the NC group. Significant reduced gray matter volume in AD patients was shown in warm yellows.
Figure 3 — Evaluating the association between brain atrophy, hypometabolism, and cognitive decline in Alzheimer’s disease: a PET/MRI study | Aging