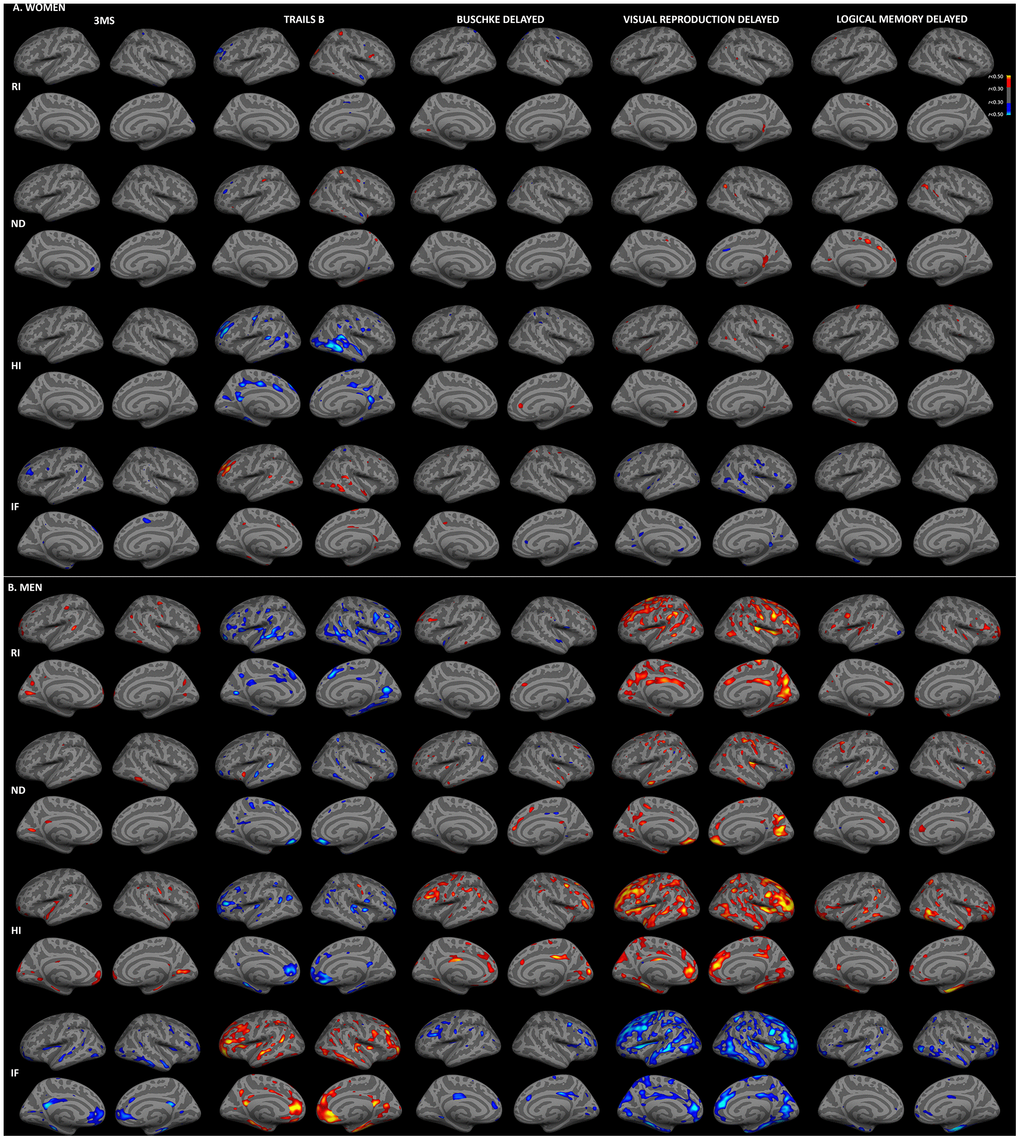
Figure 3.Sex-stratified associations between cortical gray matter microstructure and cognitive function, adjusted for age. Partial correlations between RSI metrics and cognitive test scores, adjusted for age and education, are shown for women (A) and men (B) (r>0.30). Figure conventions are the same as for Figure 1.