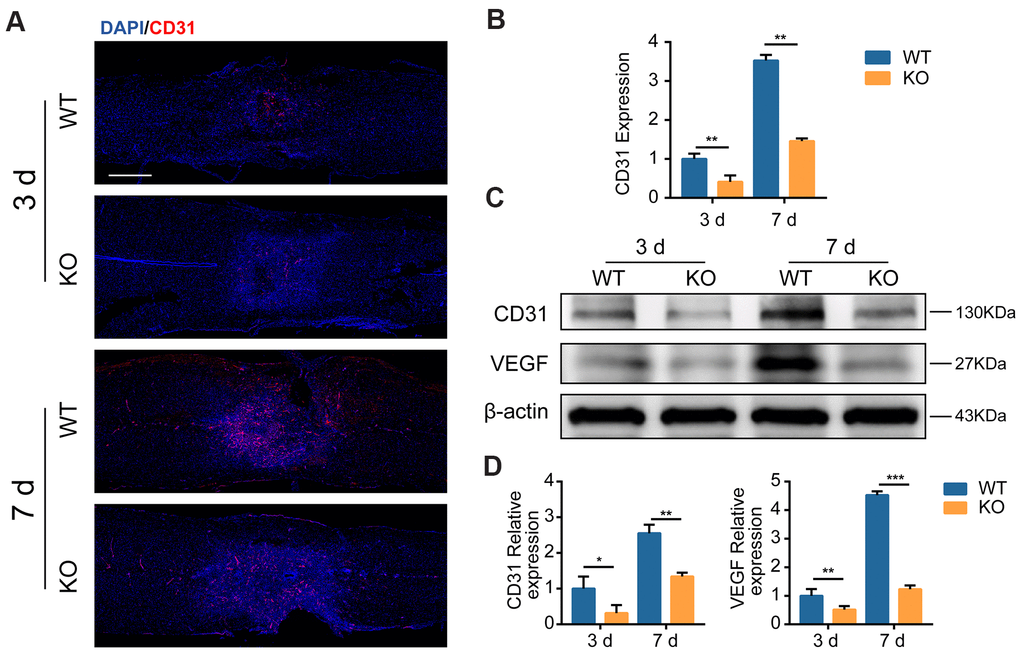
Figure 4.GIT1 promotes MECs angiogenesis in vivo. (A, B) Representative IF and quantification of microvessels and MECs at the injury core in the GIT1 WT and KO groups at day 3 and 7 after SCI. Nuclei were counterstained with DAPI (blue). Bar = 500 μm. (C, D) Representative western blots of CD31 and VEGF and the semiquantification of relative expression levels of CD31 and VEGF. N = 5 animals in each group. *p < 0.05, **p < 0.01, ***p < 0.001.