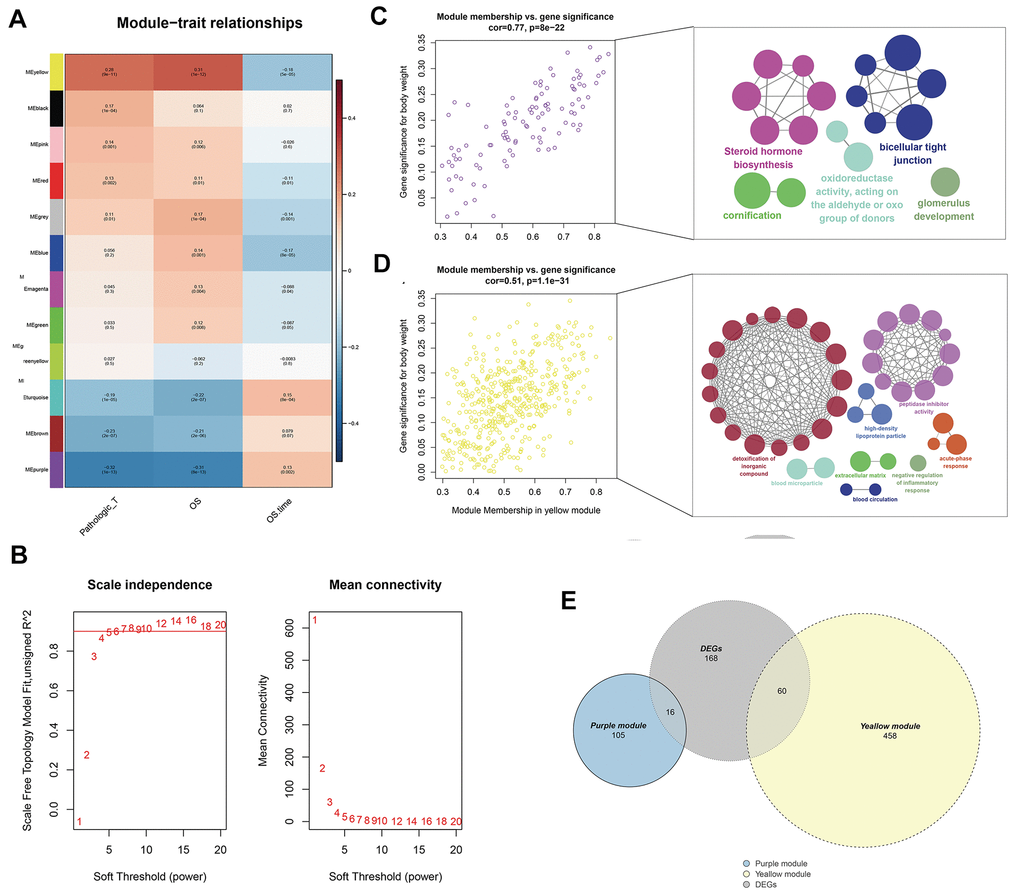
Figure 2.Identification of modules associated with the T classification in the TCGA-KIRC dataset. (A) Module-trait relationships. Each row corresponds to a color module and column corresponds to a clinical trait. Each cell contains the corresponding correlation and P-value; (B) The scale independence and mean connectivity; (C) The purple module genes and their GO analysis in ClueGO; (D) The yellow module genes and their GO analysis in ClueGO; (E) The venn plot of yellow module genes, purple module genes and DEGs.