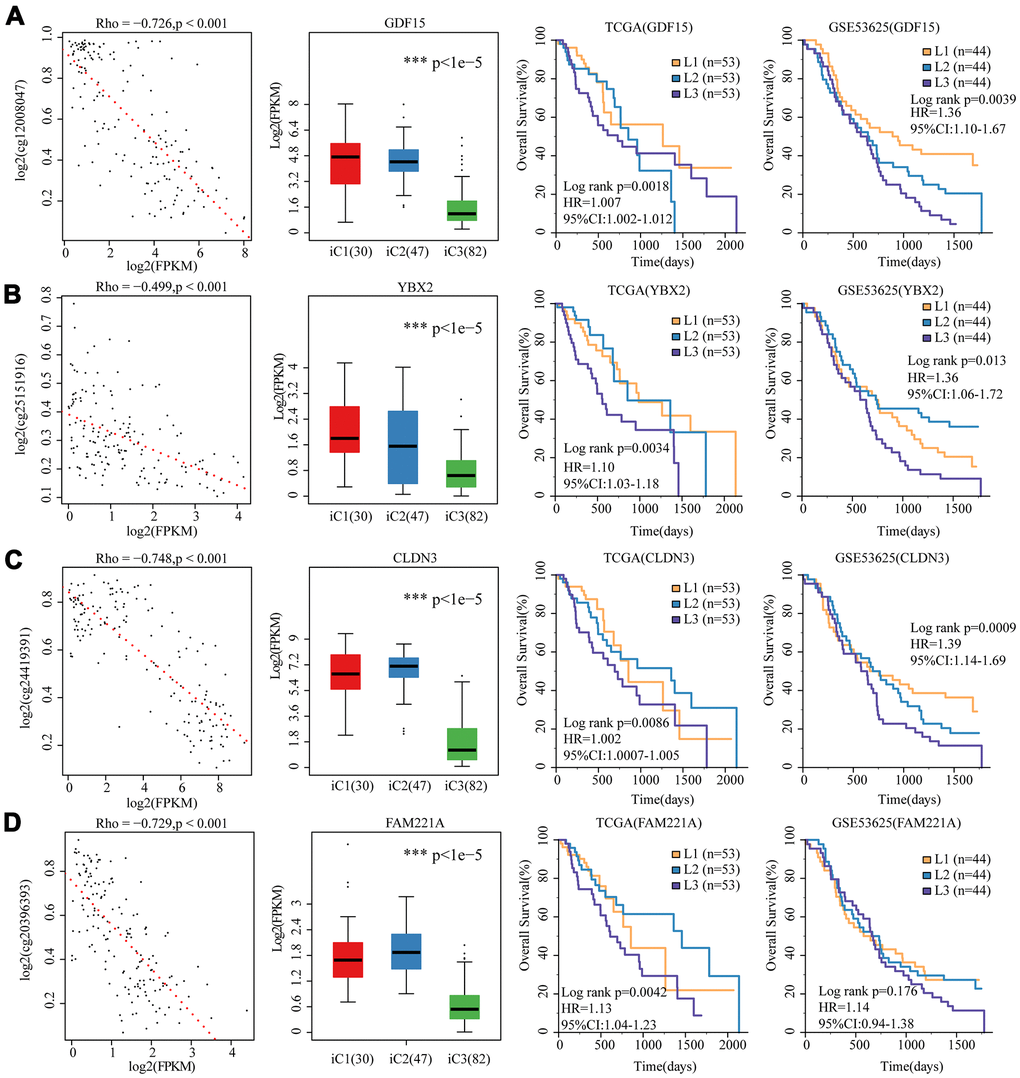
Figure 8.4 genes as potential biomarkers for the three molecular subtypes. The relationship between gene expression (horizontal) and methylation (vertical) levels (left panel), expression distribution in three iCluster subtypes (middle panel), and overall survival proportions in TCGA and GSE53625 data sets (right panel) were analyzed for (A) GDF15, (B) YBX2, (C) CLDN3 and (D) FAM221A.