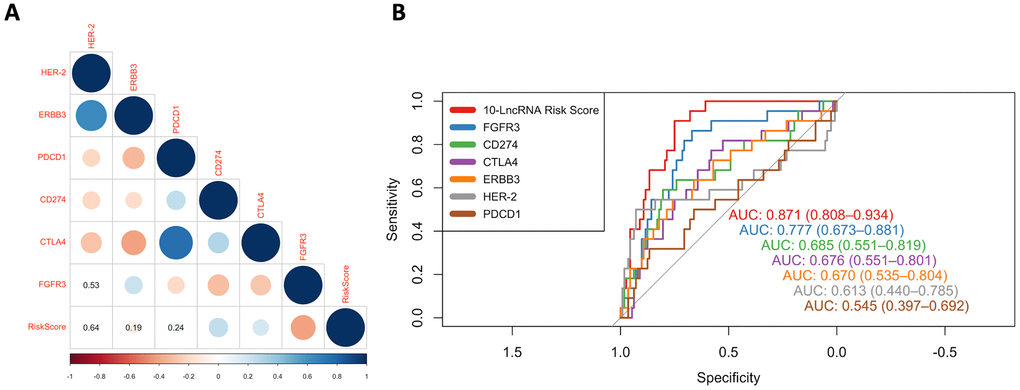
Figure 9.ROC curves and correlation analysis of different prognostic signatures. (A) Correlation analyses among known immune checkpoints, potential therapeutic targets and the risk score. The circle size represents the P value, and the colour represents the correlation coefficient. Blue indicates a positive correlation, and red indicates a negative correlation. (B) ROC curves show the sensitivity and specificity of our 10-lncRNA signature and other known biomarkers in predicting the DSS of patients from GSE32894.