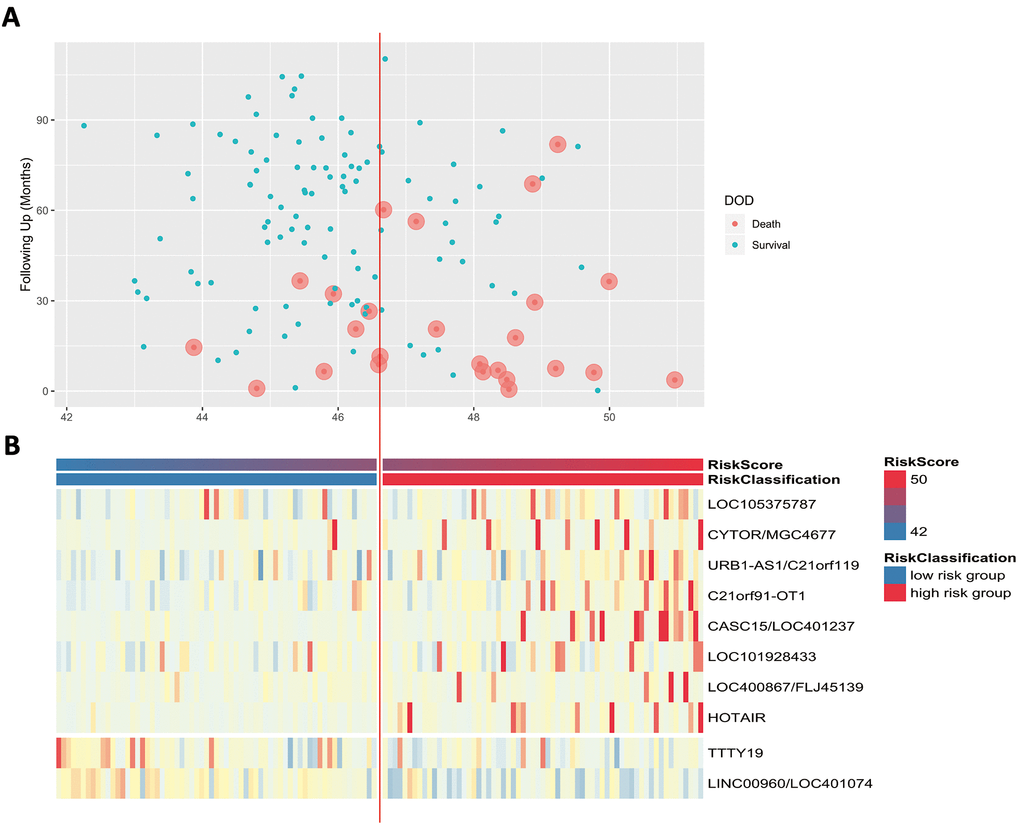
Figure 5.(A) Patients’ survival status and DSS time. (B) Heatmap of the lncRNA expression profiles. Rows represent lncRNA expression, and columns represent patients. The middle dividing lines represent the median lncRNA risk score cut-off point. The graduated colour, from blue to red, represents the risk score.