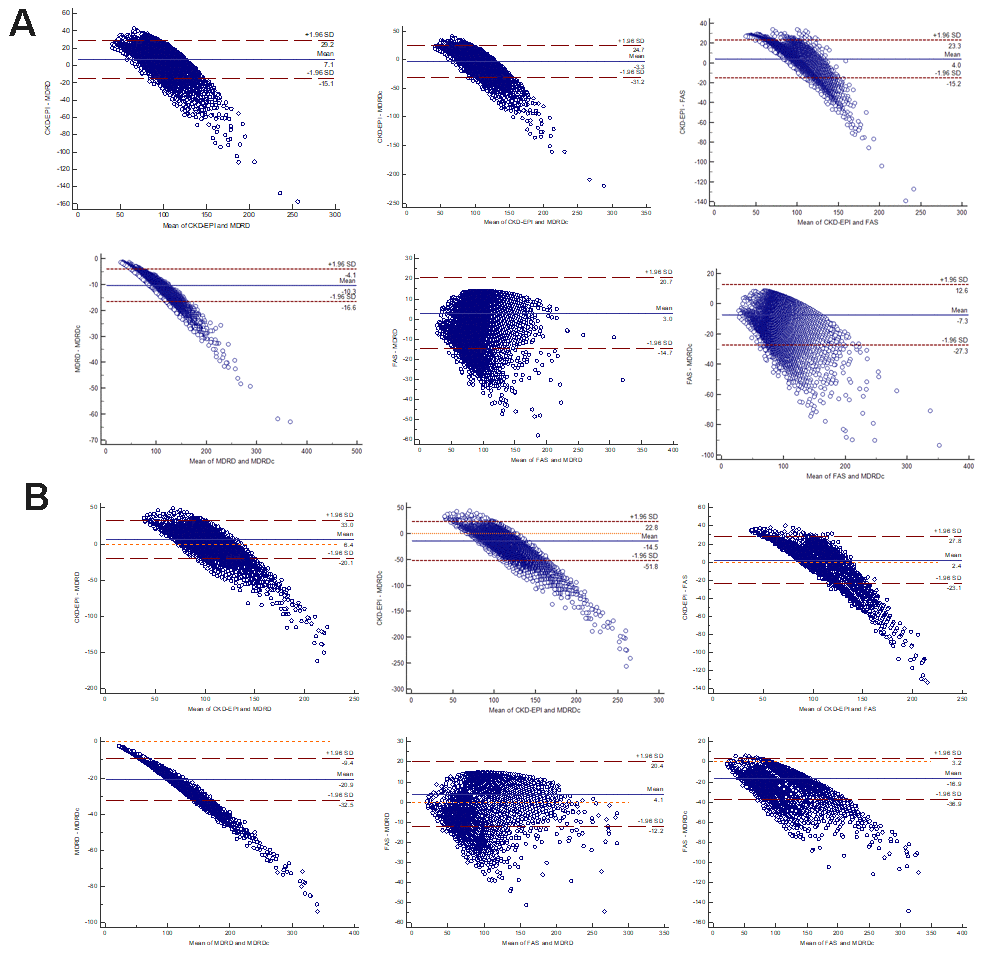
Figure 4.Bland-Altman scatter plot for different equations. (A) Male. (B) Female. CKD-EPI: Chronic Kidney Disease Epidemiology Collaboration equation; MDRD: Modification of Diet in Renal Disease Study equation; MDRDc: Chinese MDRD equation; FAS: Full Age Spectrum.