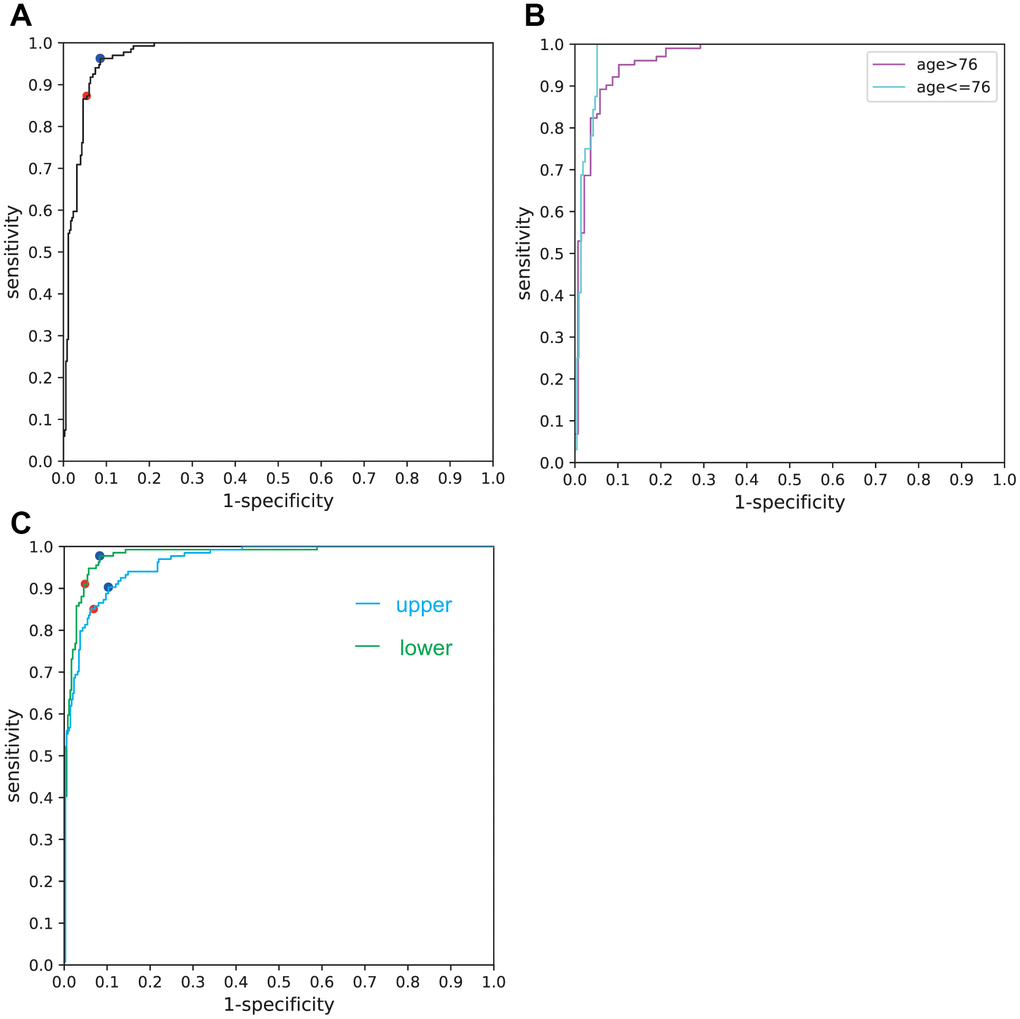
Figure 2.(A) ROC curve for the overall facial images used. The red dot denotes the sensitivity and specificity calculated by the AI software (boundary: Face AI score = 0). The blue dot denotes the sensitivity and specificity calculated by ROC analysis (boundary: Face AI score = −1.51). (B) ROC curve for the aged (>76) and the relatively young (≤76). (C) ROC curve for upper half and lower half faces.