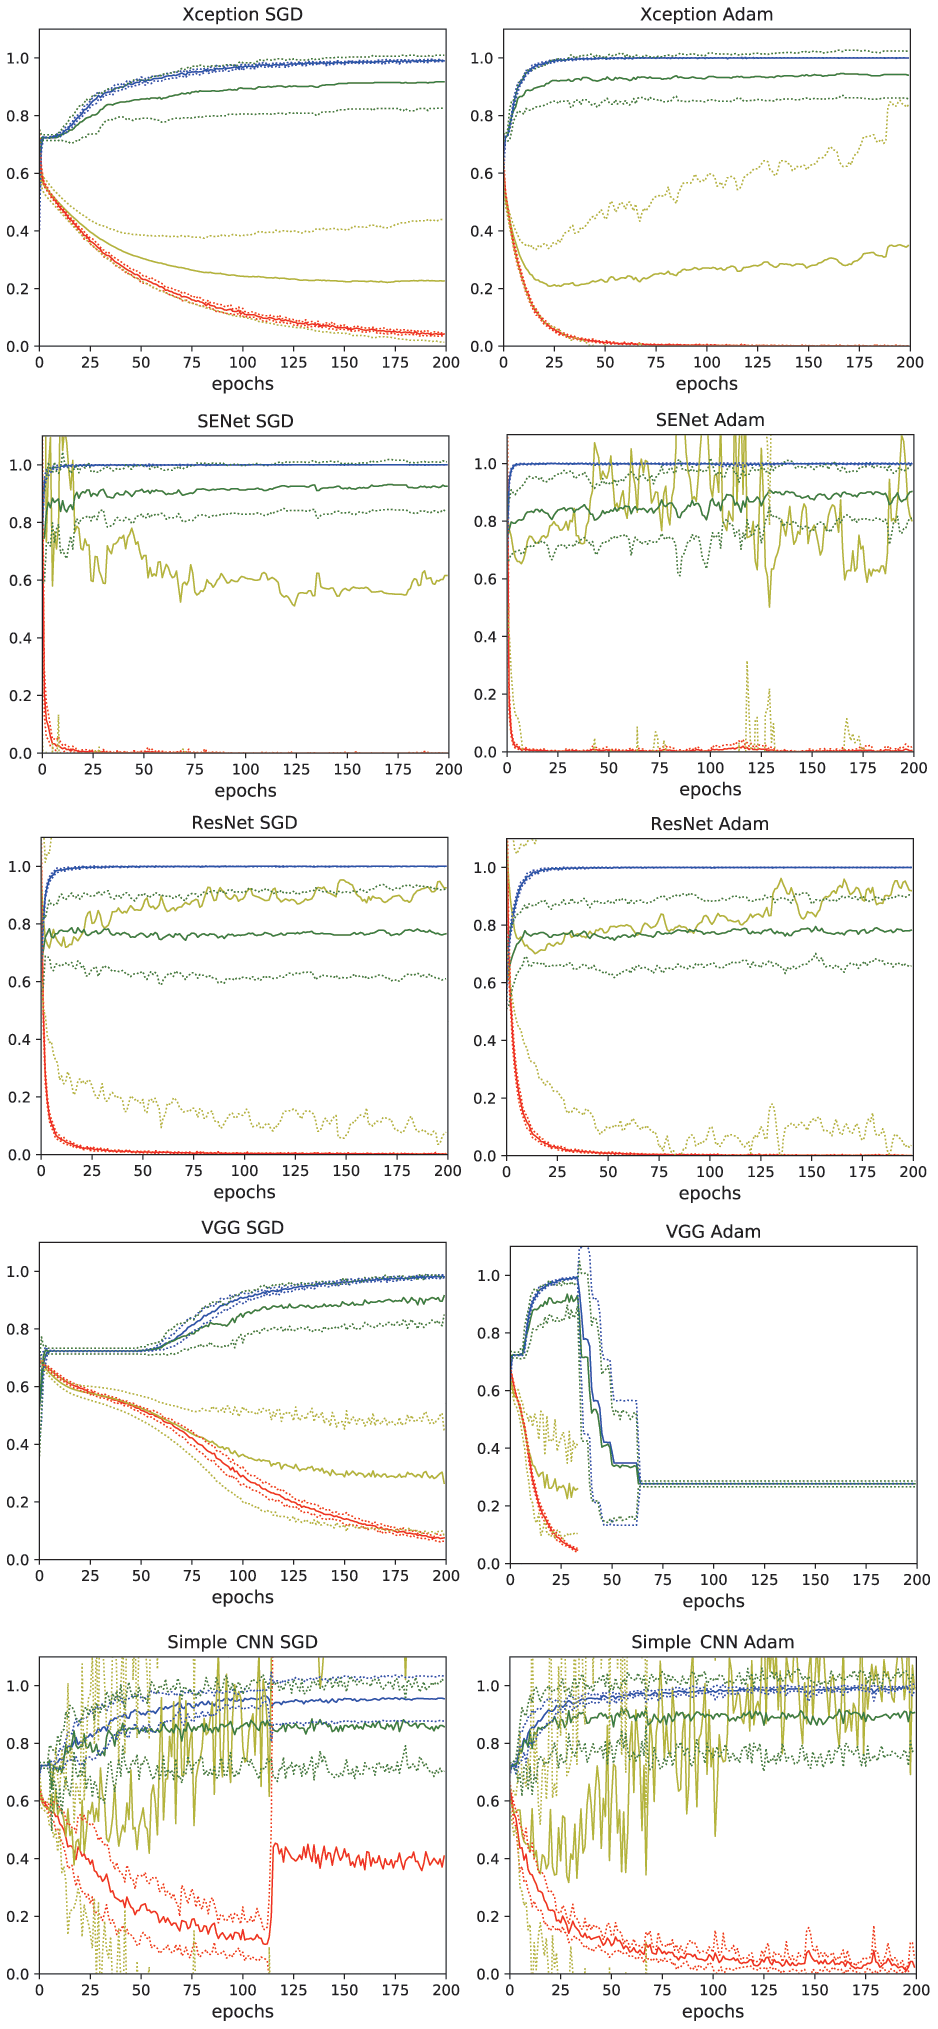
Figure 1.Learning curves of the deep learning models. Xception, SENet50, ResNet50, VGG16, and simple CNN with SGD and Adam optimizers were tested. The thin lines denote mean ± standard deviation of 10 groups. blue: accuracy, red: loss, green: validation accuracy, yellow: validation loss.