Submit an Article
Navigate
Home
Editorial Board
Editorial Policies
Current Volume
Archive
Scientific Integrity
Publication Ethics Statements
Interviews with Outstanding Authors
Newsroom
Sponsored Conferences
Podcast
Contact
Special Collections
Submit an Article
Online ISSN: 1945-4589
Research Paper
|
Volume 13, Issue 5
|
pp. 6740–6751
Interleukin-33 modulates immune responses in cutaneous melanoma in a context-specific way
Back to article
Figure 5
(5 of 5)
−
100%
+
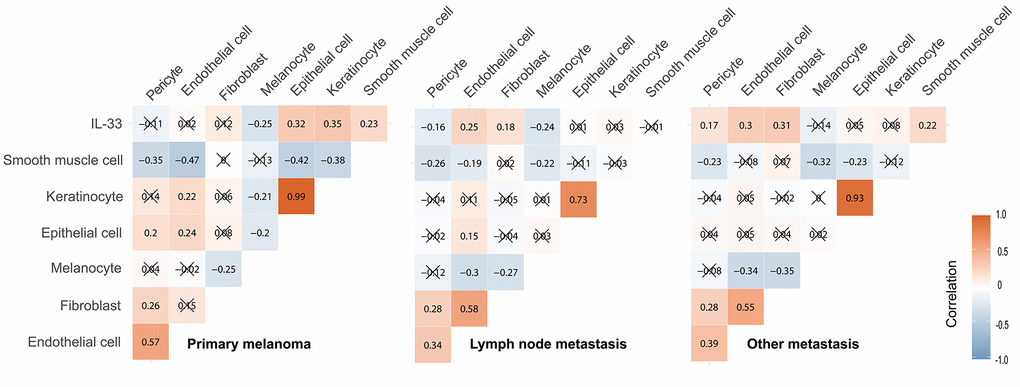
Figure 5.
Correlation between the IL-33 expression level and the abundance of potential cellular sources.
The Pearson correlation coefficients were shown in squares. Cross symbol means that the correlation is statistically insignificant.