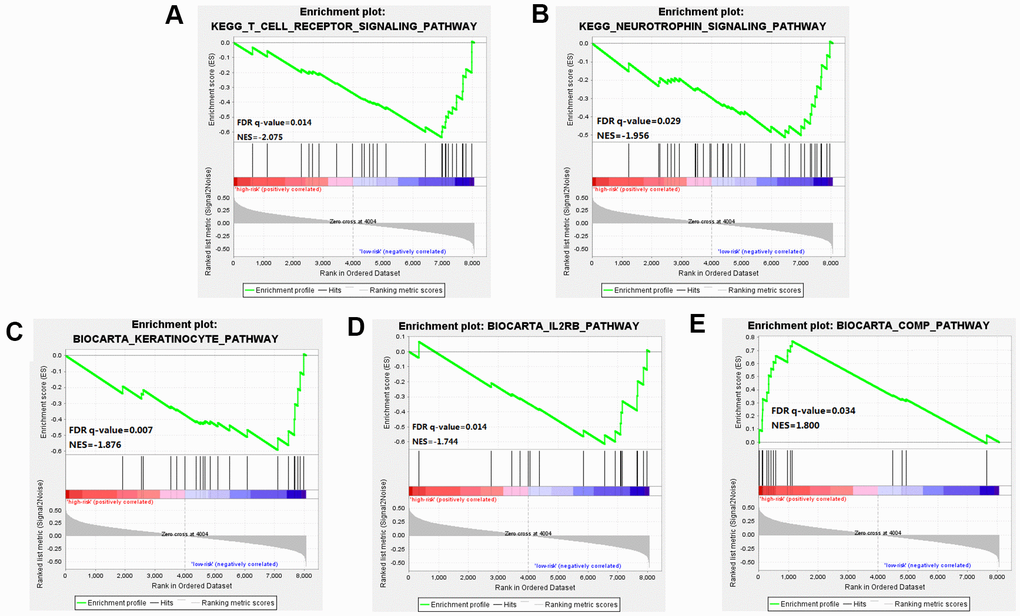
Figure 6.Gene Set Enrichment Analysis (GSEA) was performed between the high risk score group and the low-risk score group. (A–D) Pathways including IL-2 Receptor Beta Chain in T cell Activation, Keratinocyte Differentiation, T cell receptor pathway, and Neurotrophin signaling pathway were enriched in the low-risk group. (E) The results showed significant enrichment of markers including the "complement pathway" in the high-risk group.