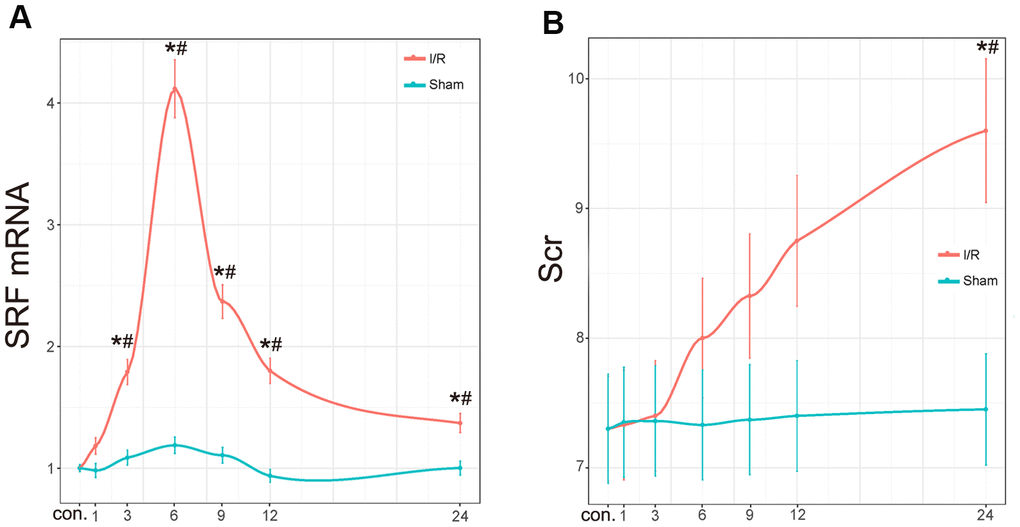
Figure 3.Scr level and renal SRF mRNA expression in I/R rats. (A) mRNA expression of SRF in I/R kidneys. The trend line was calculated by local polynomial regression fitting. (B) Scr levels in I/R rats. Data are expressed as the mean ± SE (N=7 in each group). *P<0.05 versus the sham group, #P<0.05 versus the control group. Data are representative of at least three separate experiments.