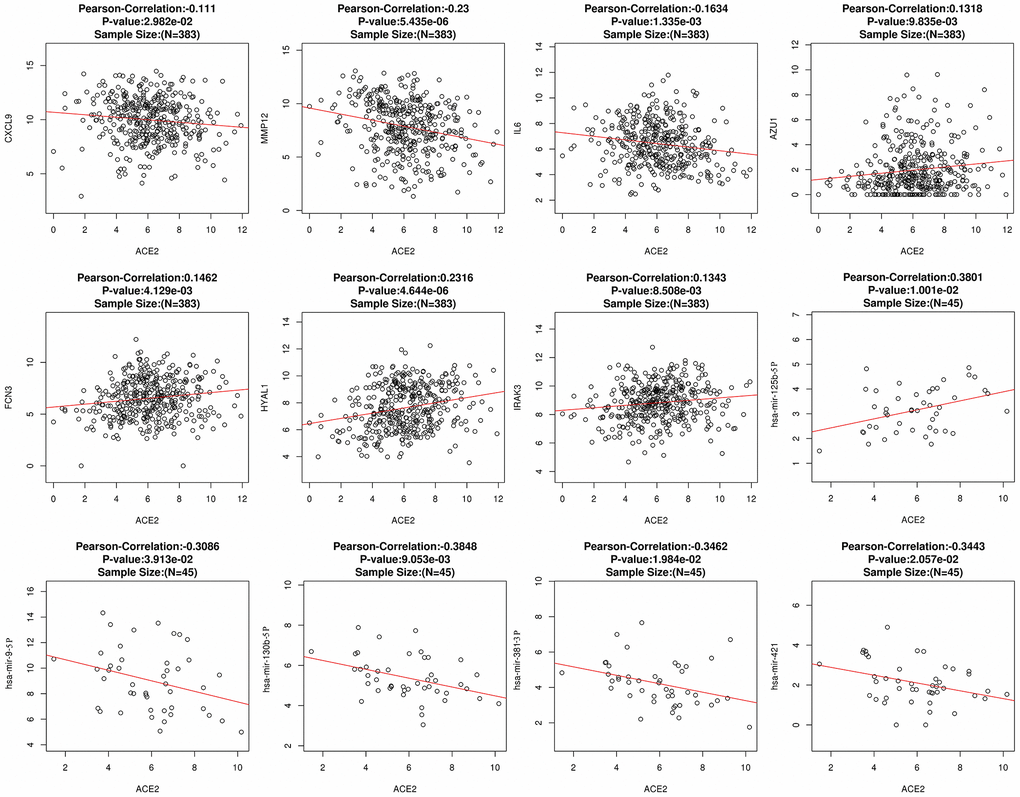
Figure 3.The correlation between ACE2 and DECGs or DECMs. Each hollow circle represents a single sample. The red line represents the correlation. A total of 383 and 45 samples were obtained to calculate the correlation between ACE2 and DECGs or DECMs, respectively.