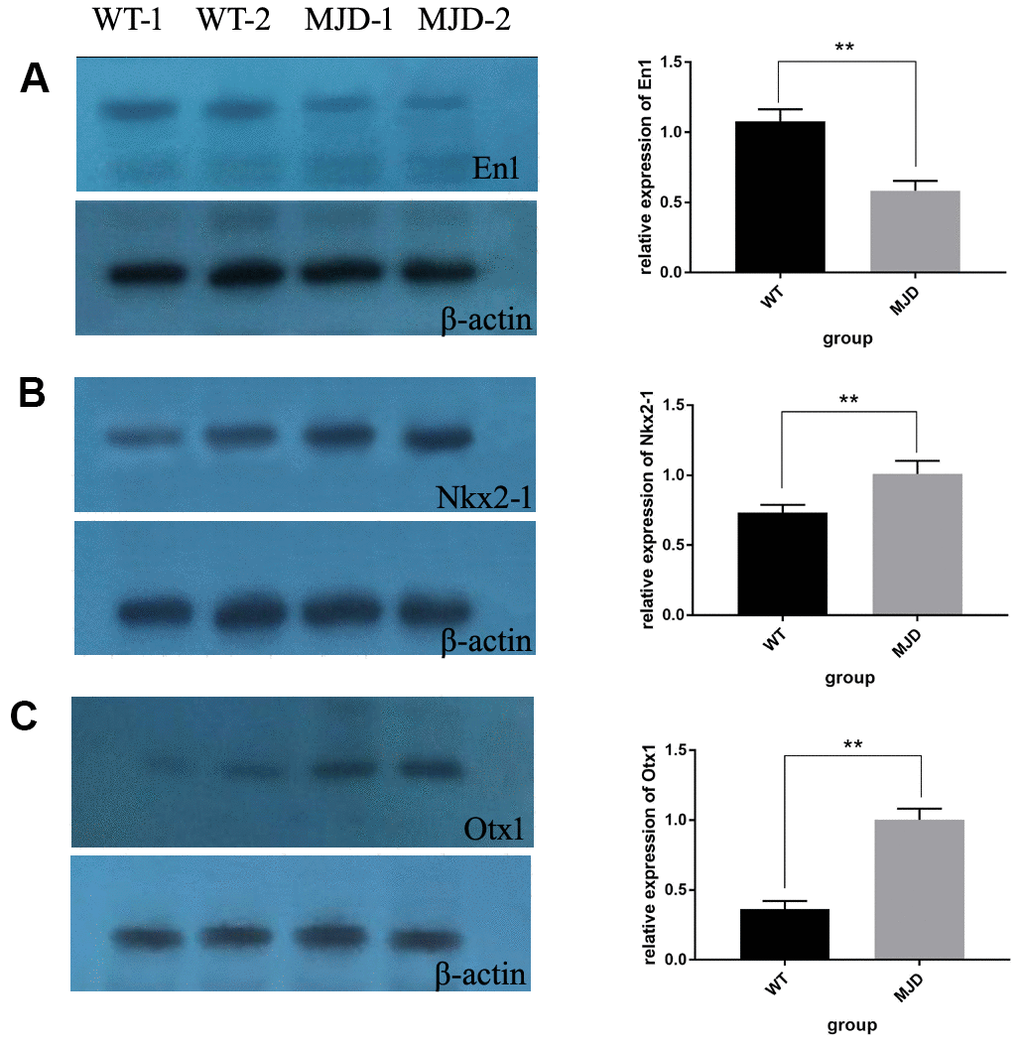
Figure 4.Protein levels of En1, Nkx2-1, and Otx1 in 32-week old mice cerebellum. (A) Western blot analysis of En1 in both control and SCA3/MJD groups. Compared to control group, the protein level of En1 was significantly downregulated in SCA3/MJD group (p<0.05). (B) Western blot analysis of Nkx2-1 in both control and SCA3/MJD groups. Compared to control group, the protein level of Nkx2-1 was significantly upregulated in SCA3/MJD group. (C) Western blot analysis of Otx1 in both control and SCA3/MJD groups. Compared to control group, the protein level of Otx1 was significantly upregulated in SCA3/MJD group.