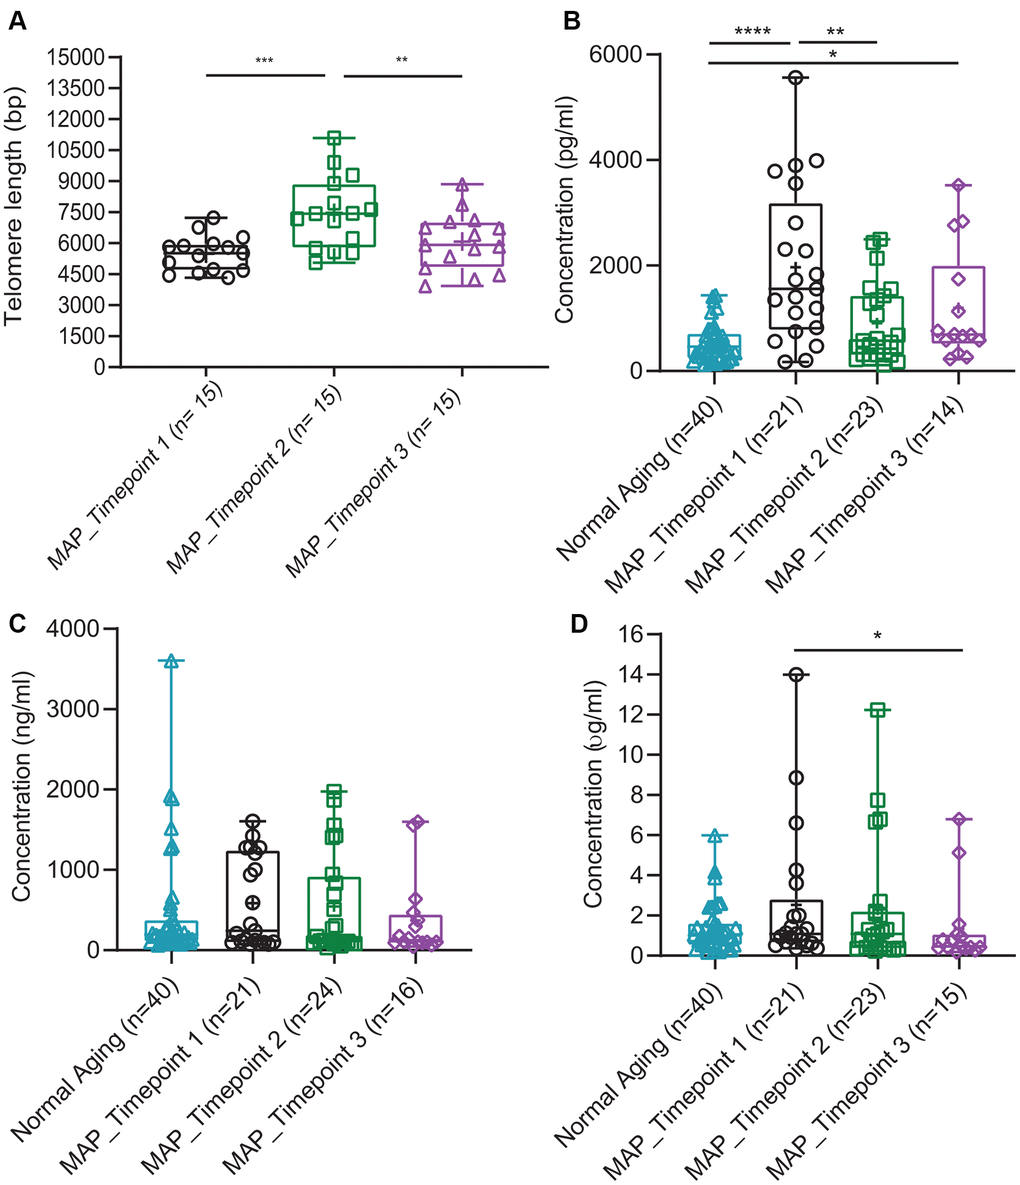
Figure 5.Comparison of four blood biomarkers in Normal Aging and MAP groups. (A) Mean of telomere length over time in the MAP intervention study. P values were calculated by Wilcoxon matched-pairs signed-rank t test comparing the two groups. The samples of Normal Aging were not measured for telomere length. (B) Concentrations of BDNF (pg/ml), (C) DHEAS (ng/ml) and (D) hs-CRP (μg/ml) comparing Normal Aging and three timepoints of MAP groups. Significant different two-tailed p values of Mann-Whitney U test are presented as **** p < 0.0001, *** p ≥ 0.0001 - < 0.001, ** p ≥ 0.001 - < 0.01, * p ≥ 0.01- < 0.05. In each box plot, median line, + mean, upper and lower quartiles, upper and lower extremes and whiskers are presented. The groups of the subjects represented by three different color-coded symbols with sample size are indicated in parenthesis in the legend. MAP= Mindful Awareness Program, BDNF= Brain-derived neurotrophic factor, DHEAS= Dehydroepiandrosterone sulfate, hs-CRP= High sensitive C-reactive protein.