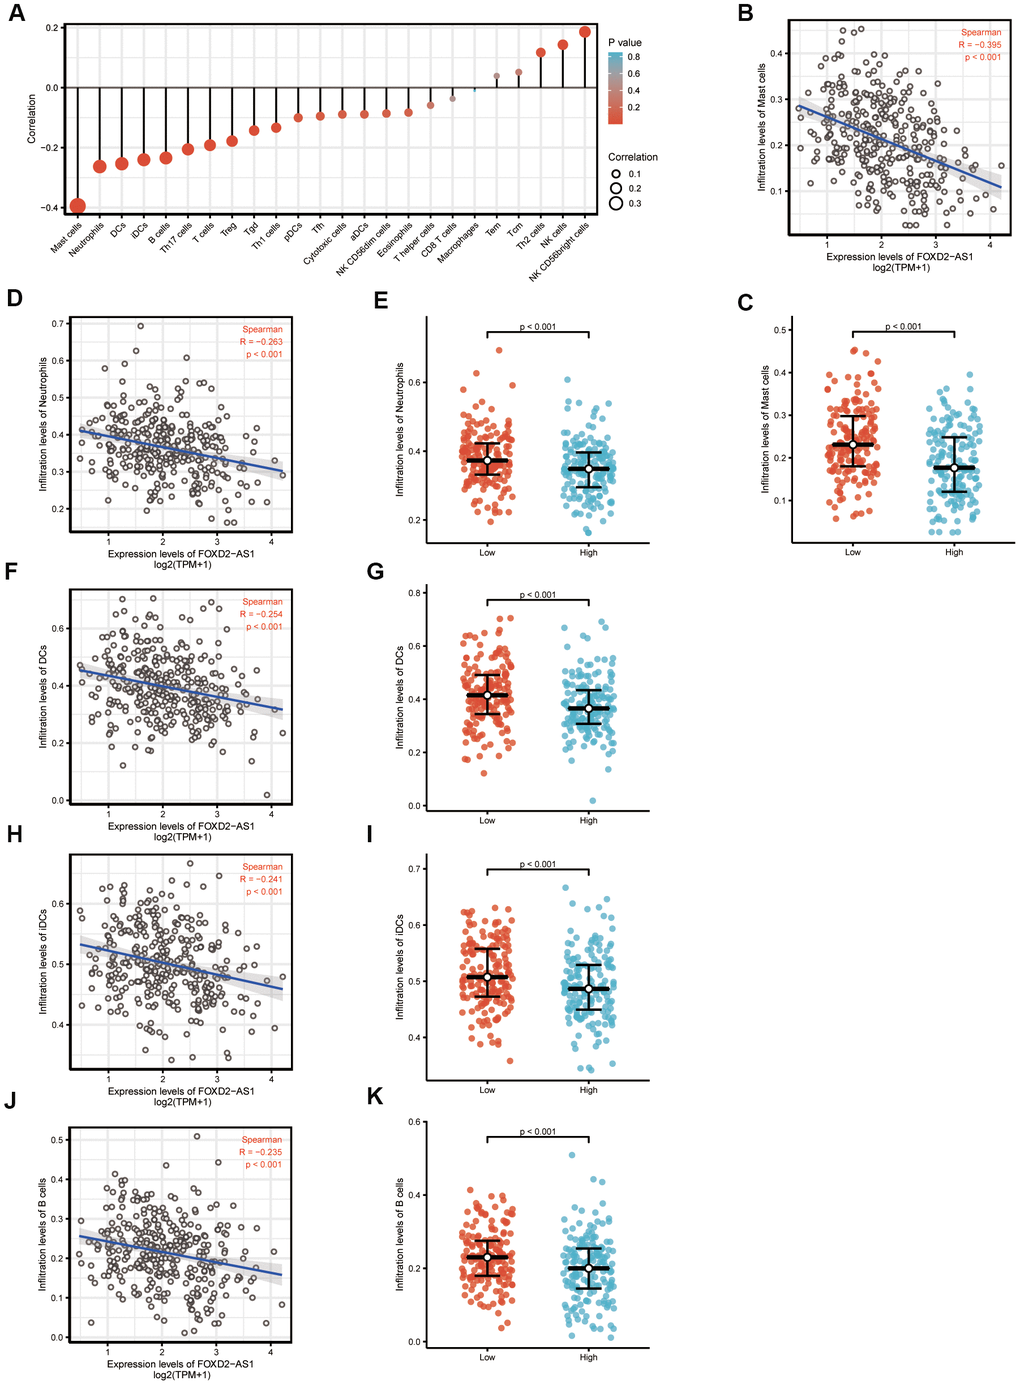
Figure 6.The expression level of FOXD2-AS1 was associated with the immune infiltration in tumor environment. (A) The plots showed the correlation between FOXD2-AS1 expression and immune cells subsets. (B) Spearman correlation between expression of FOXD2-AS1 and mast cells. (C)The plots of mast cells expression in low and high FOXD2-AS1 samples. (D–K) Spearman correlation and expression distribution of Neutrophils, DC cells, iDC cells and B cells in low and high FOXD2-AS1 samples.