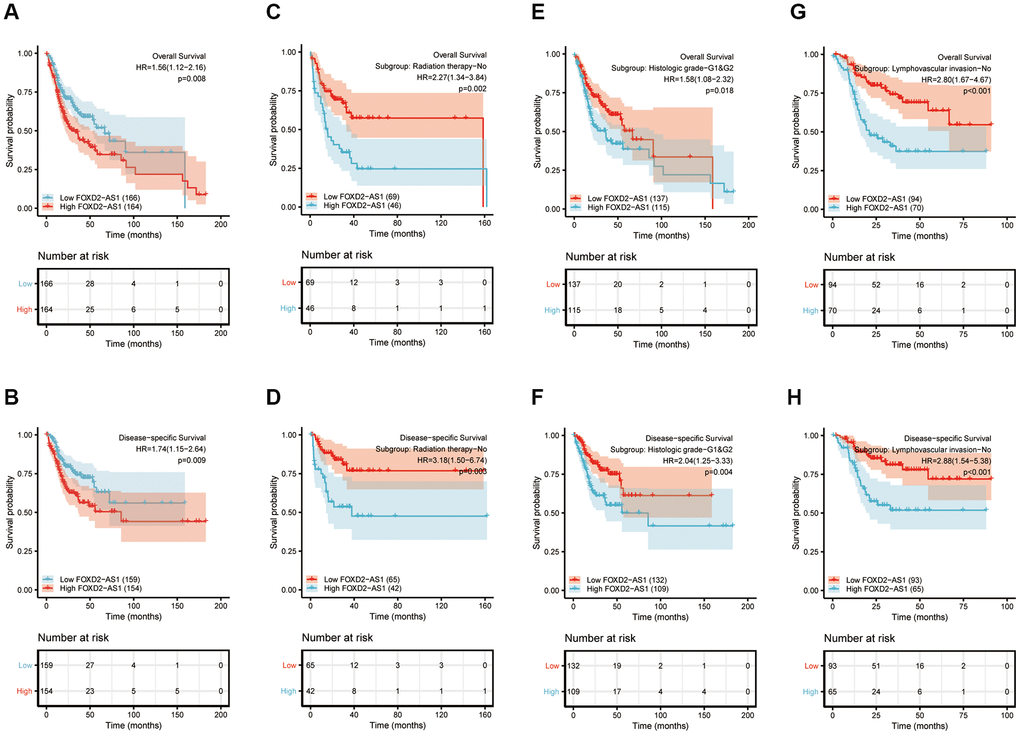
Figure 3.Prognostic value of FOXD2-AS1 in OSCC. (A, B) Kaplan-Meier curves of OS and DSS with different expression level of FOXD2-AS1. (C, D) Kaplan-Meier curves of OS and DSS with different expression level of FOXD2-AS1 in non-radiation therapy group. (E, F) Kaplan-Meier curves of OS and DSS with different expression level of FOXD2-AS1 in histologic grade I and grade II group. (G, H) Kaplan-Meier curves of OS and DSS with different expression level of FOXD2-AS1 in non-lymphovascular invasion group.