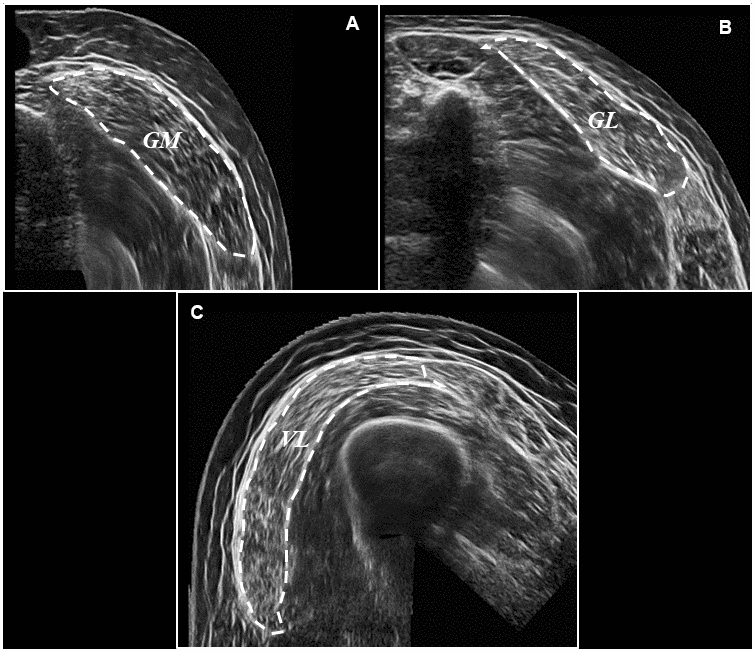
Figure 4.Representative ultrasound images following panoramic ultrasound imaging. Panel (A) represents a transverse image of GM CSA (outlined for effect) at 50% of muscle length, Panel (B) represents a transverse image of GL CSA (outlined for effect) at 50% of muscle length, and Panel (C) represents a transverse image of VL CSA (outlined for effect) also at 50% of muscle length.