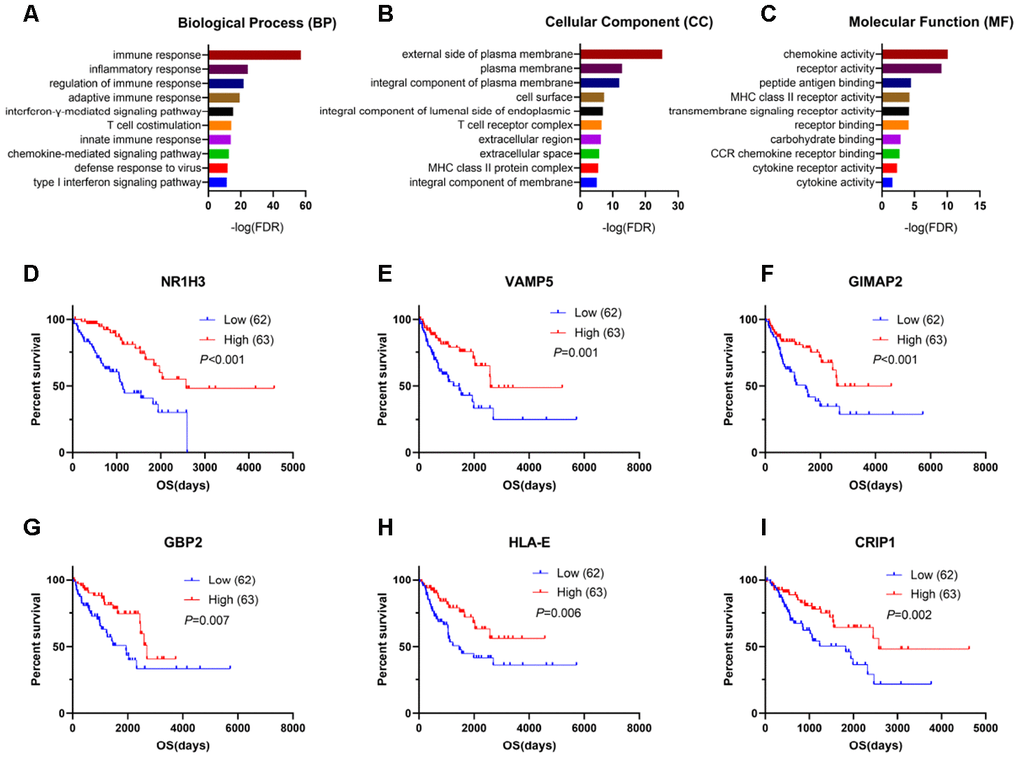
Figure 3.Genes for survival prediction among sarcoma patients. (A–C) Enrichment analysis of good survival-related genes among sarcoma patients. (D–I) The Kaplan-Meier survival curves for sarcoma patients further separated into the high and low expression groups based on the quartiles of the NR1H3, VAMP5, GIMAP2, GBP2, HLA-E and CRIP1 mRNA levels, separately.