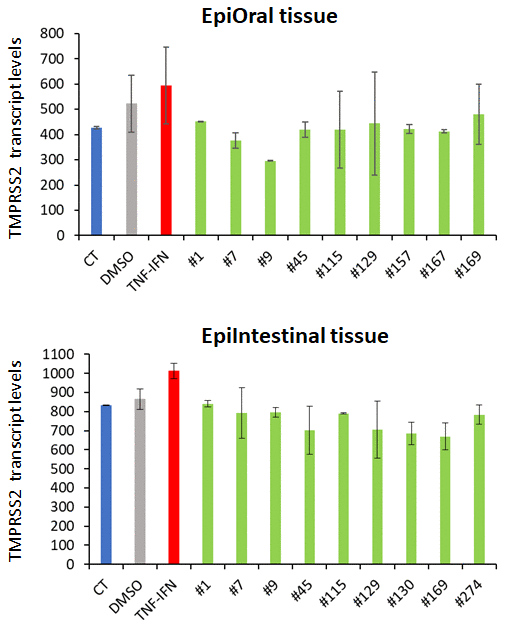
Figure 7.Effects of novel C. sativa extracts on the levels of TMPRSS2 gene expression in the EpiOral and EpiIntestinal tissue models. Each bar is an average (with SD) of two samples, as per Materials and Methods. The Y axis shows the arbitrary units of TMPRSS2 gene expression, while the X axis shows the samples.