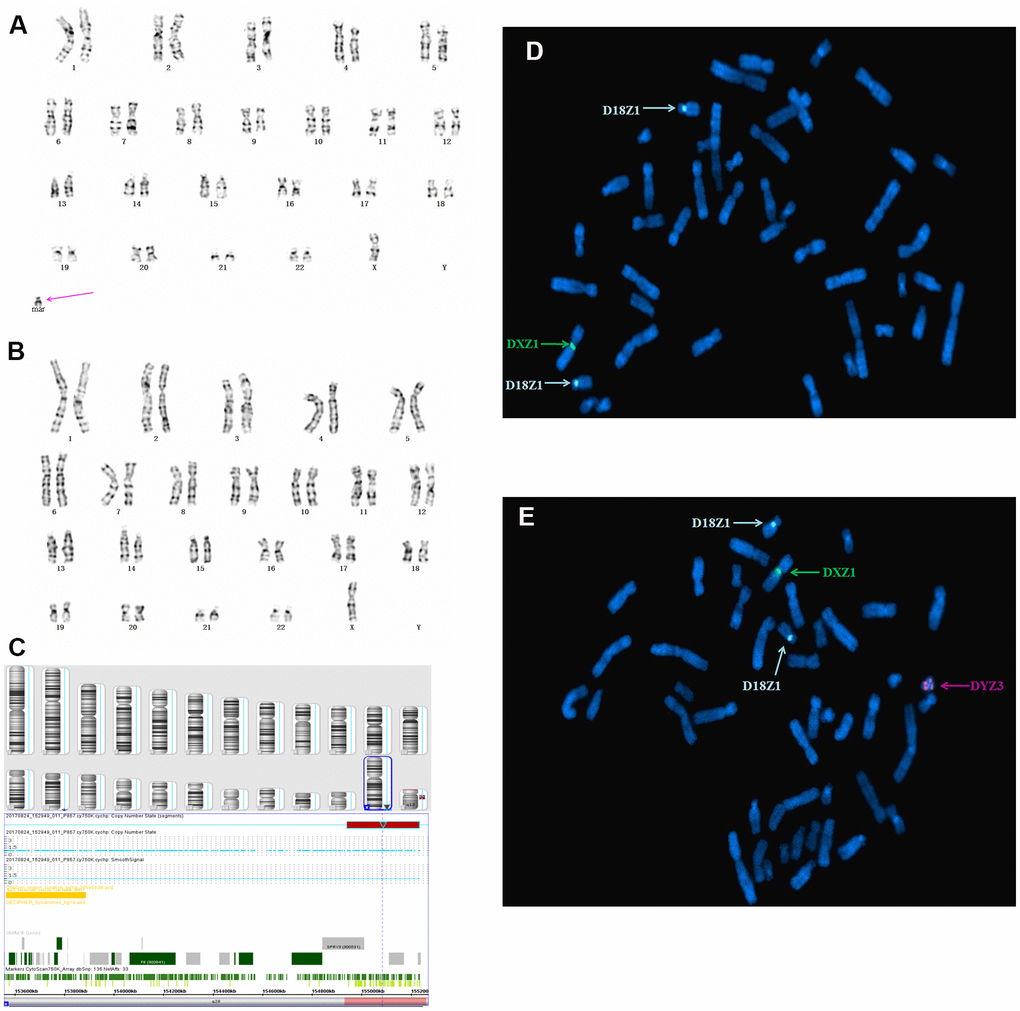
Figure 3.Karyotype, CMA, and FISH analyses results for fetus 3. The purple arrow identifies the sSMC. (A) and (B) conventional karyotype analysis revealed 45,X[62]/46,X,+mar[9]. (C) SNP array analysis revealed a 2.3 Mb genomic gain in Yq11.221q11.222 and a 6.1 Mb genomic loss in q11.222q11.23, spanning 15 OMIM genes, including HSFY1, PRY, DAZ1, AZFb, and AZFc. (D, E) Metaphase FISH analysis using X, Y, and 18 chromosomal centromeric probes revealed the karyotype of fetus 3 to be 45,X(DXZ1×1, DYZ3×0)[22]/46,X,idic(Y)(q11.2?) (DYZ3×2,DXZ1×1)[2]/47,X,idic(Y)(q11.2?)×2(DYZ3×4,DXZ1×1)[1].