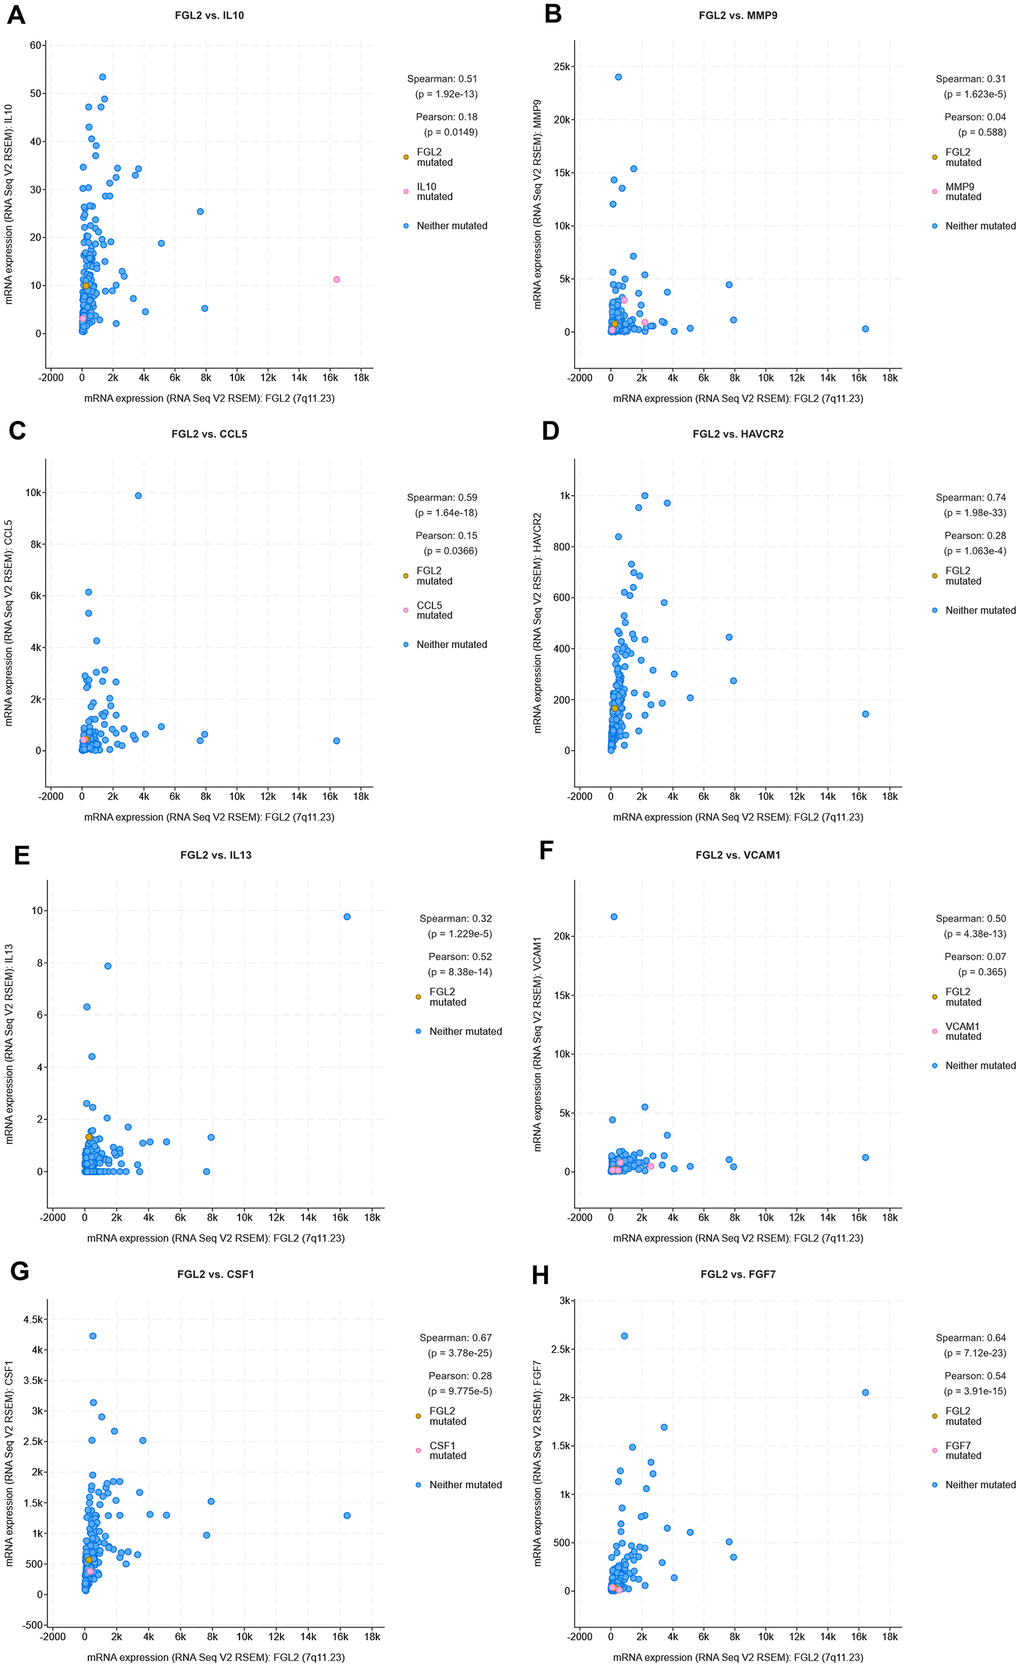
Figure 8.Correlation analysis between cytokine and FGL2 levels in ESCA tissues using cBioPortal. (A–H) Scatterplots depicting the correlations between the levels of FGL2 and IL-10 (A), MMP9 (B), CCL5 (C), TIM-3 (D), IL-13 (E), VCAM1 (F), M-CSF (CSF1) (G) and FGF-7 (H). A Spearman’s P < 0.05 was considered statistically significant.