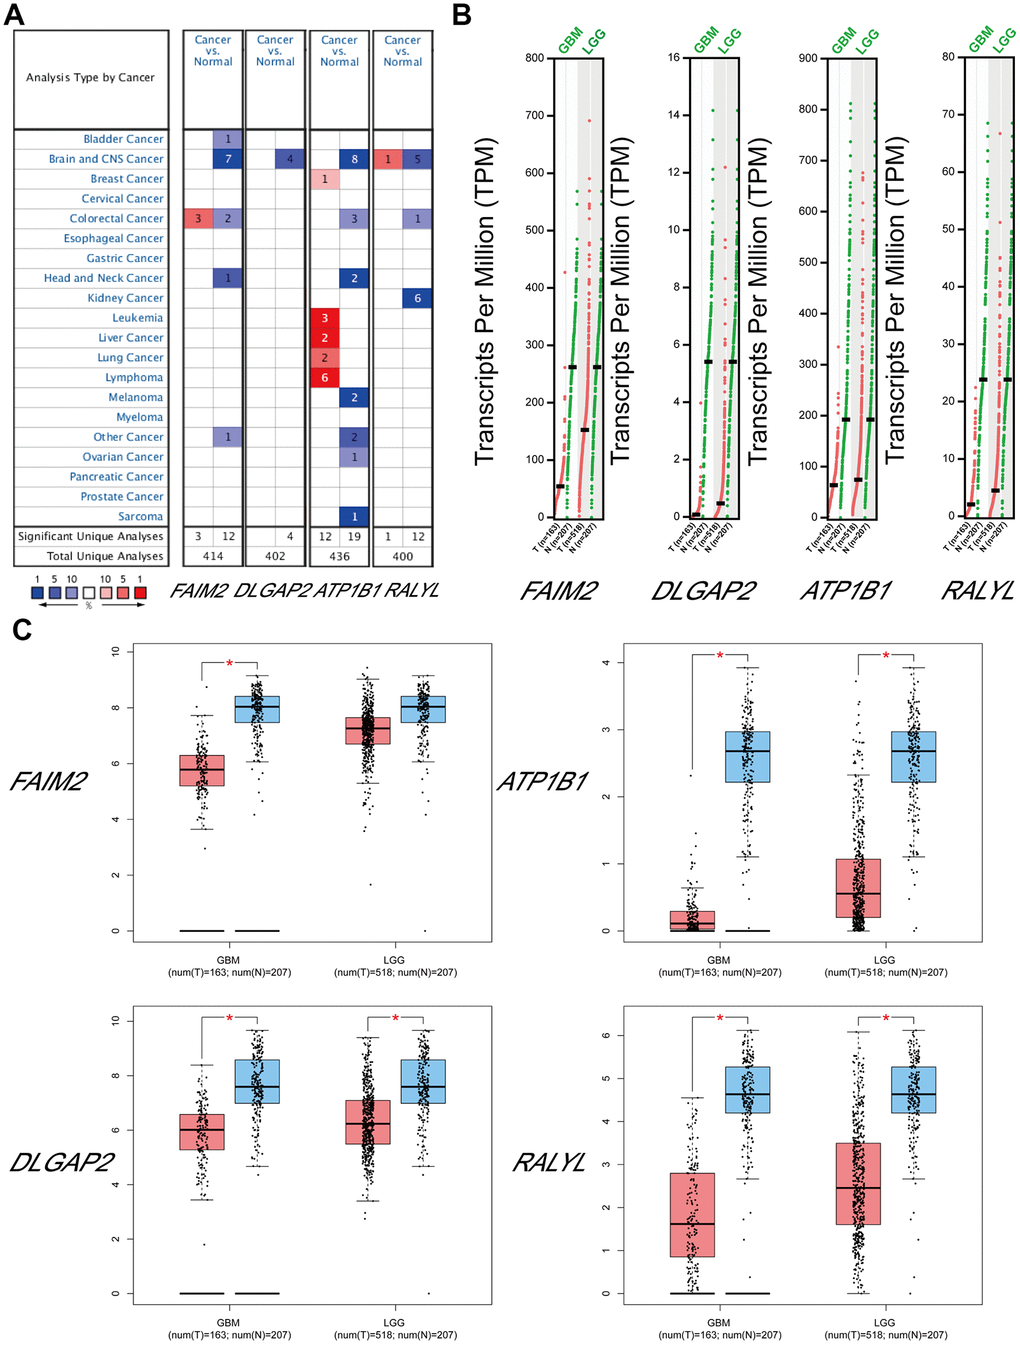
Figure 7.The expression levels of target mRNAs. (A) The expression levels of FAIM2, DLGAP2, ATP1B1 and RALYL in multiple cancers using ONCOMINE databases. (B, C) The expression levels of FAIM2, DLGAP2, ATP1B1 and RALYL in GBM and LGG using GEPIA databases.