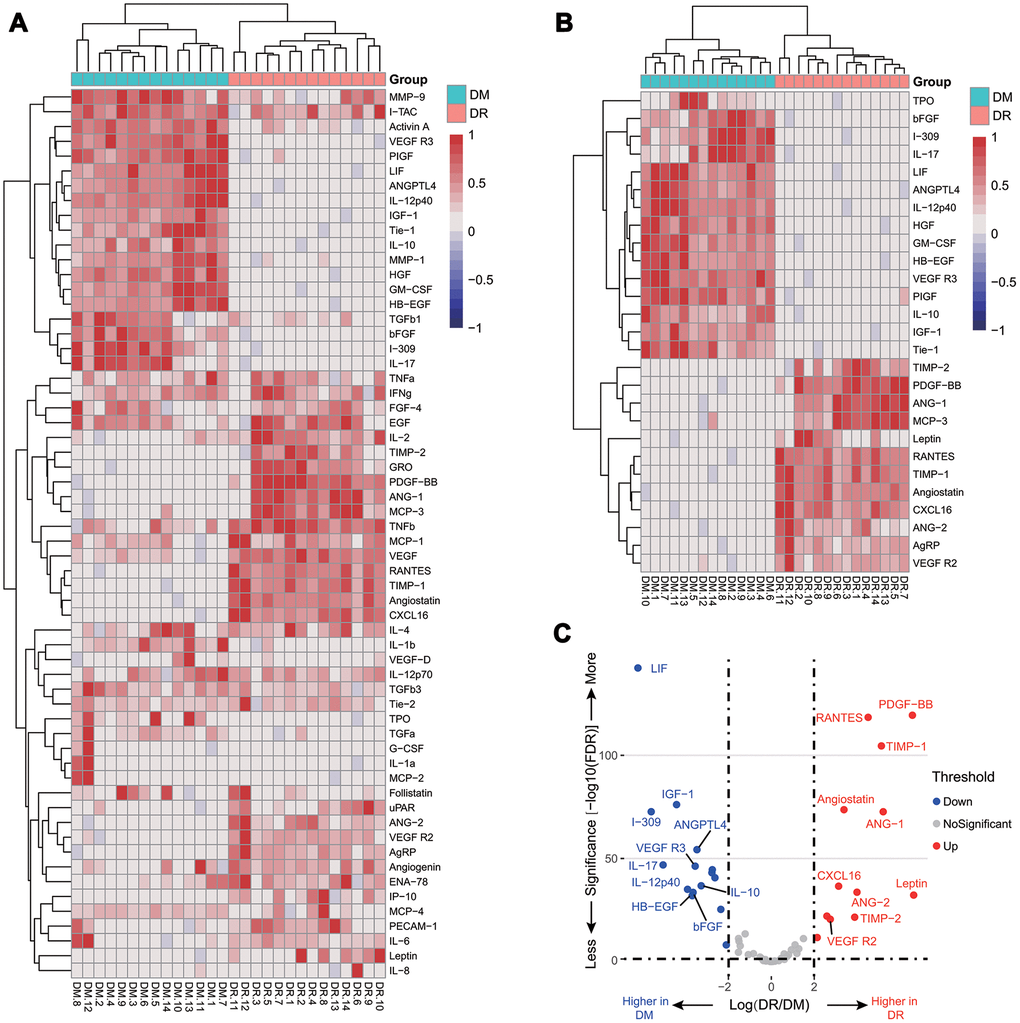
Figure 1.Relative cytokine changes in the pilot cohort. A heat map of relative changes of all 60 plasma cytokines (A); a heat map of 27 cytokines with a fold change larger than 4 or less than 0.25 (B); a volcano plot of the top 10 increasing and decreasing cytokines (C).