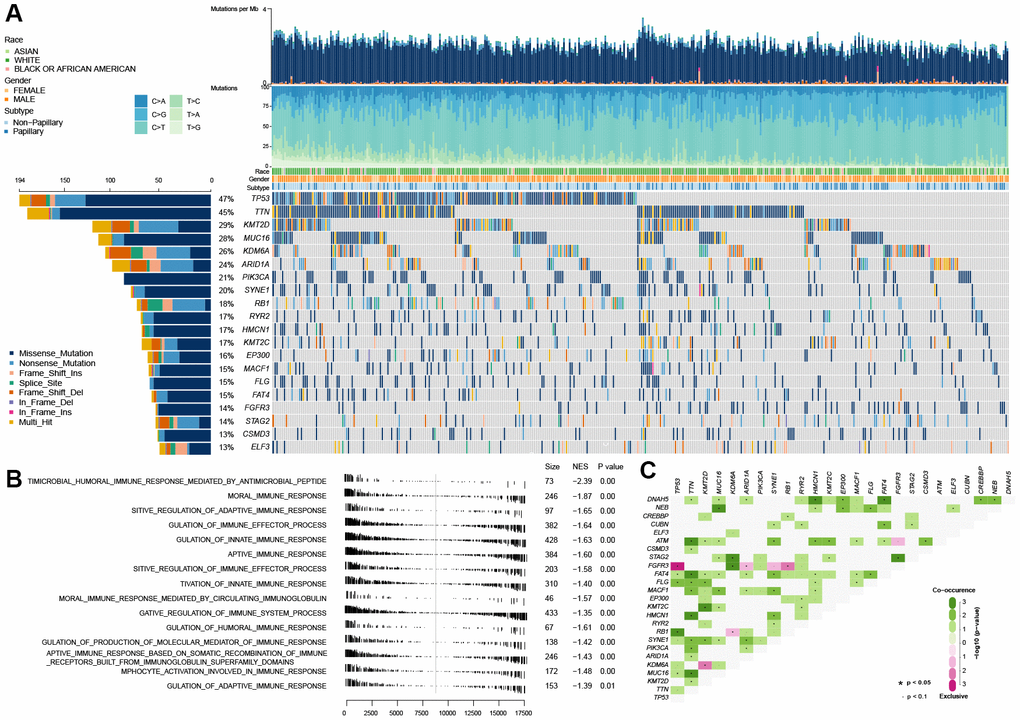
Figure 1.Gene set enrichment analysis between the wild-type TP53 and mutated TP53 subgroup in TCGA MIBC dataset. (A) The landscape of somatic mutations in TCGA MIBC dataset. (B) 13 inhibited immune-associated biological processes in mutated TP53 MIBC patients. (C) The landscape of somatic interactions of TP53 in TCGA MIBC dataset.