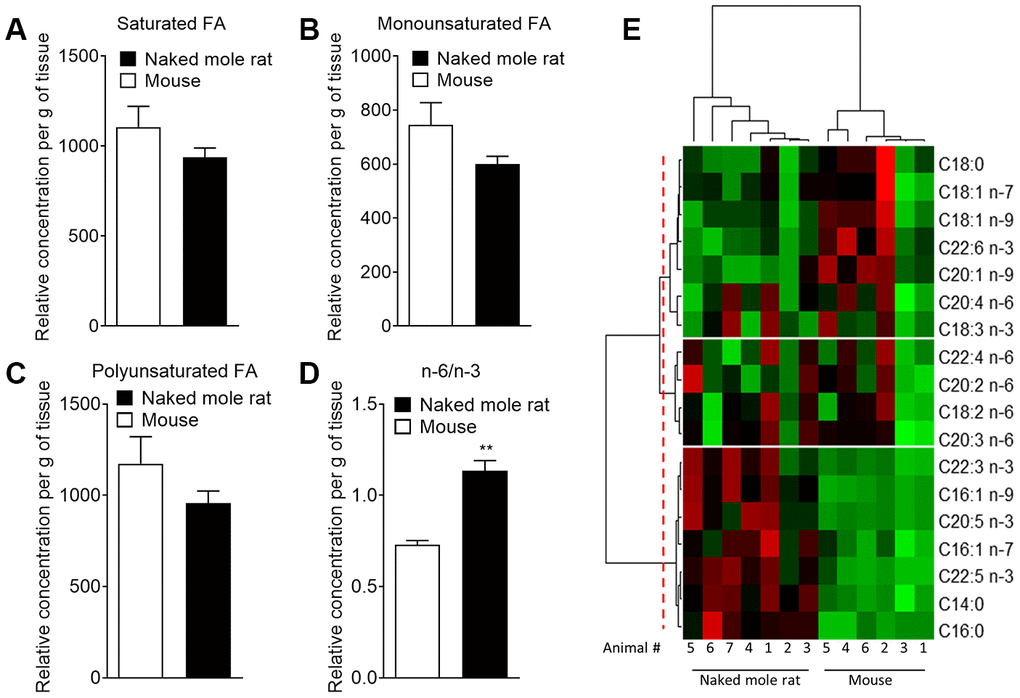
Figure 3.Mass spectrometry of brain derived total fatty acids. Lipids were taken from the brains of 7 naked mole-rats and 6 mice (2 independent experiments). Quantification of (A) saturated fatty acids, (B) monounsaturated fatty acids, (C) polyunsaturated fatty acids (PUFA), and (D) n-6 PUFA/n-3 PUFA ratio extract from mouse (white bar) or naked mole-rat (black bar) brains. Data are expressed as mean ± SEM. Statistical analysis was performed using Mann-Whitney test. **p<0.01, significantly different from mouse group. (E) Heat map of the different fatty acids (FA) quantified by LC-MS/MS. Data are shown in a matrix format: each row represents a single FA, and each column represents the lipid extract of the brain of one animal (6 mice and 7 naked mole-rat). Each colour patch represents the normalized quantity of FA (row) in a single animal brain (column), with a continuum of quantity from bright green (lowest) to bright red (highest). The pattern and length of the branches in the left dendrogram reflect the relatedness of the FA. The dashed red line is the dendrogram distance used to cluster the FA. The pattern and length of the branches in the top dendrogram reflect the relatedness of the different animals.