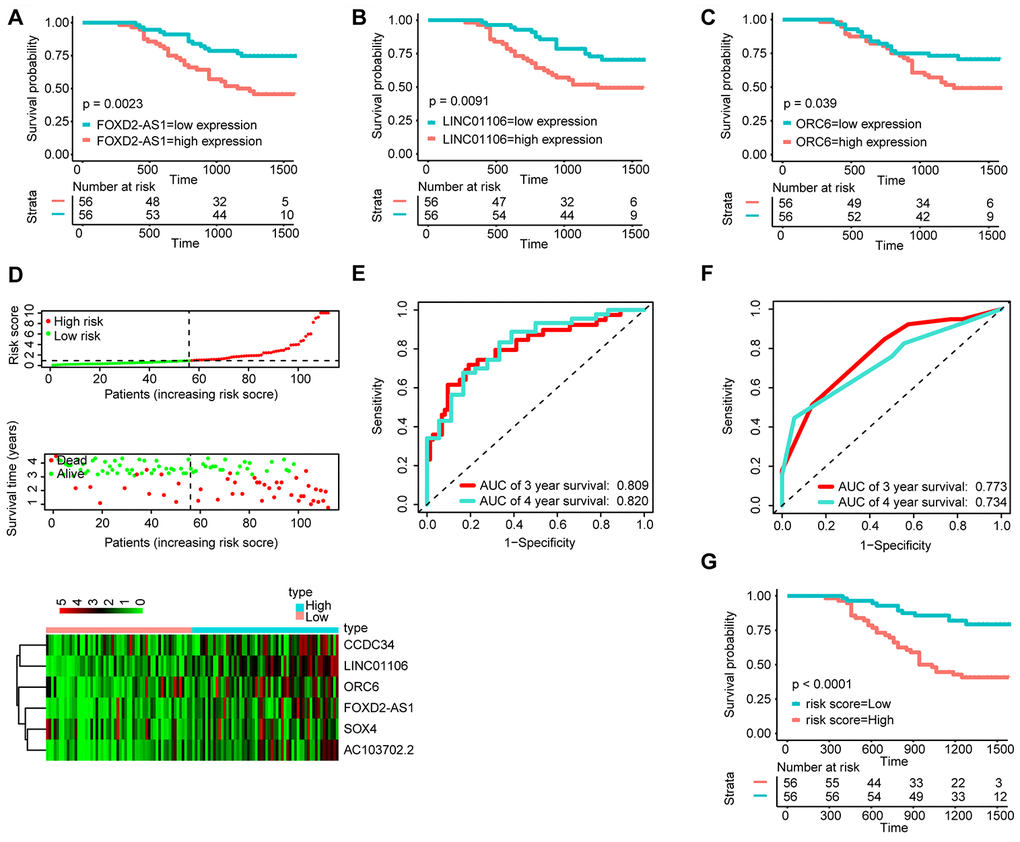
Figure 6.Validation of the signature by qRT-PCR (n=112). KM survival curves of FOXD2-AS1 (A), LINC01106 (B), and ORC6 (C); (D) Correlation between the prognostic signature and the OS of patients in the qRT-PCR cohort. Distribution of the signature scores (top), survival times (middle) and lincRNA expression levels (bottom). Black dotted lines represent the median signature score (cut-off) that was used to divide patients into the low- and high-risk groups. Red dots and lines represent patients in the high-risk group. Green dots and lines represent patients in the low-risk group. (E) ROC curve analyses based on the signature. (F) ROC curve analyses based on the traditional TNM pathological staging system. (G)KM curves of OS based on the signature.