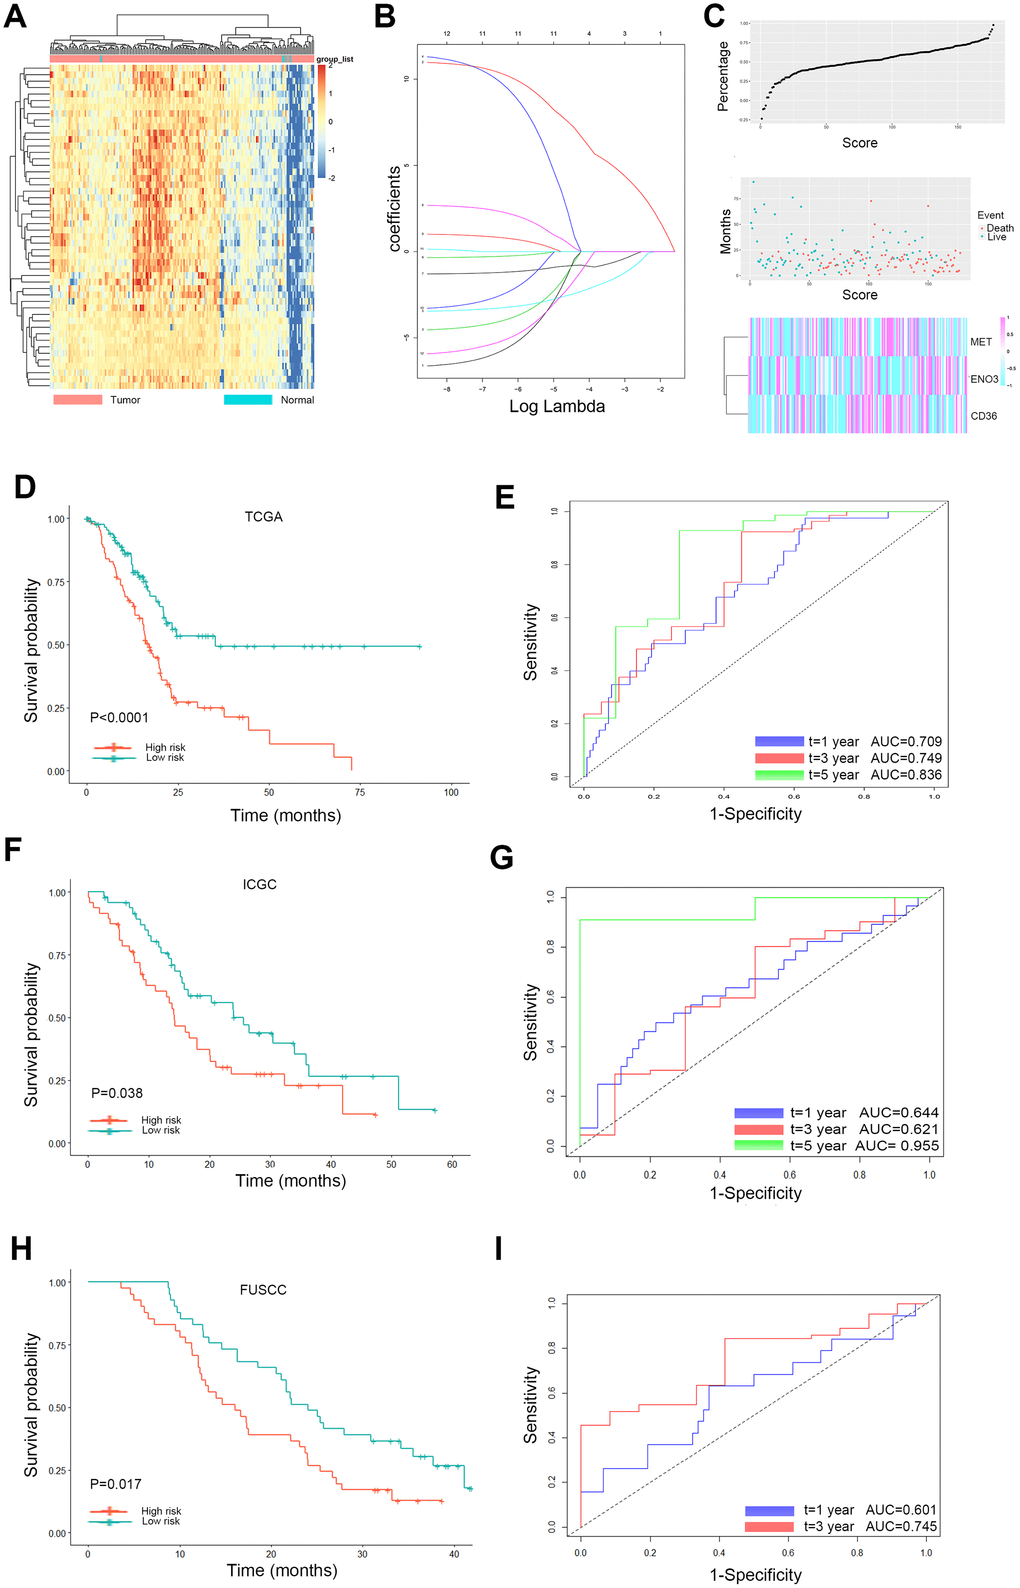
Figure 3.Lasso analysis and Kaplan-Meier curve for the patients in the TCGA, ICGC and FUSCC cohorts. (A) Representative heatmap of the DEGs significantly related to OS time identified by the log-rank test in the TCGA cohort. (B) LASSO coefficient profiles of the 12 glycolysis and lipid metabolism-based genes. LASSO, least absolute shrinkage and selection operator method. (C) Risk score analysis of the differentially expressed DEG signatures of PDAC. Risk scores of DEG signatures (top); survival status and duration of cases (middle); low-score and high-score groups for the three genes (bottom). (D) The Kaplan-Meier plot (low risk vs. high risk PDAC cases) of 5-year overall survival in the TCGA cohort. (E) Time-dependent ROC analyses at 1, 3, and 5 years in the TCGA cohort. (F) The Kaplan-Meier plot (low risk vs. high risk PDAC cases) of 5-year overall survival in the ICGC cohort. (G) Time dependent ROC analyses at 1, 3, and 5 years in the ICGC cohort. (H) The Kaplan-Meier plot (low risk vs. high risk PDAC cases) of 5-year overall survival in the FUSCC cohort (I). Time dependent ROC analyses at 1, 3, and 5 years in the FUSCC cohort.