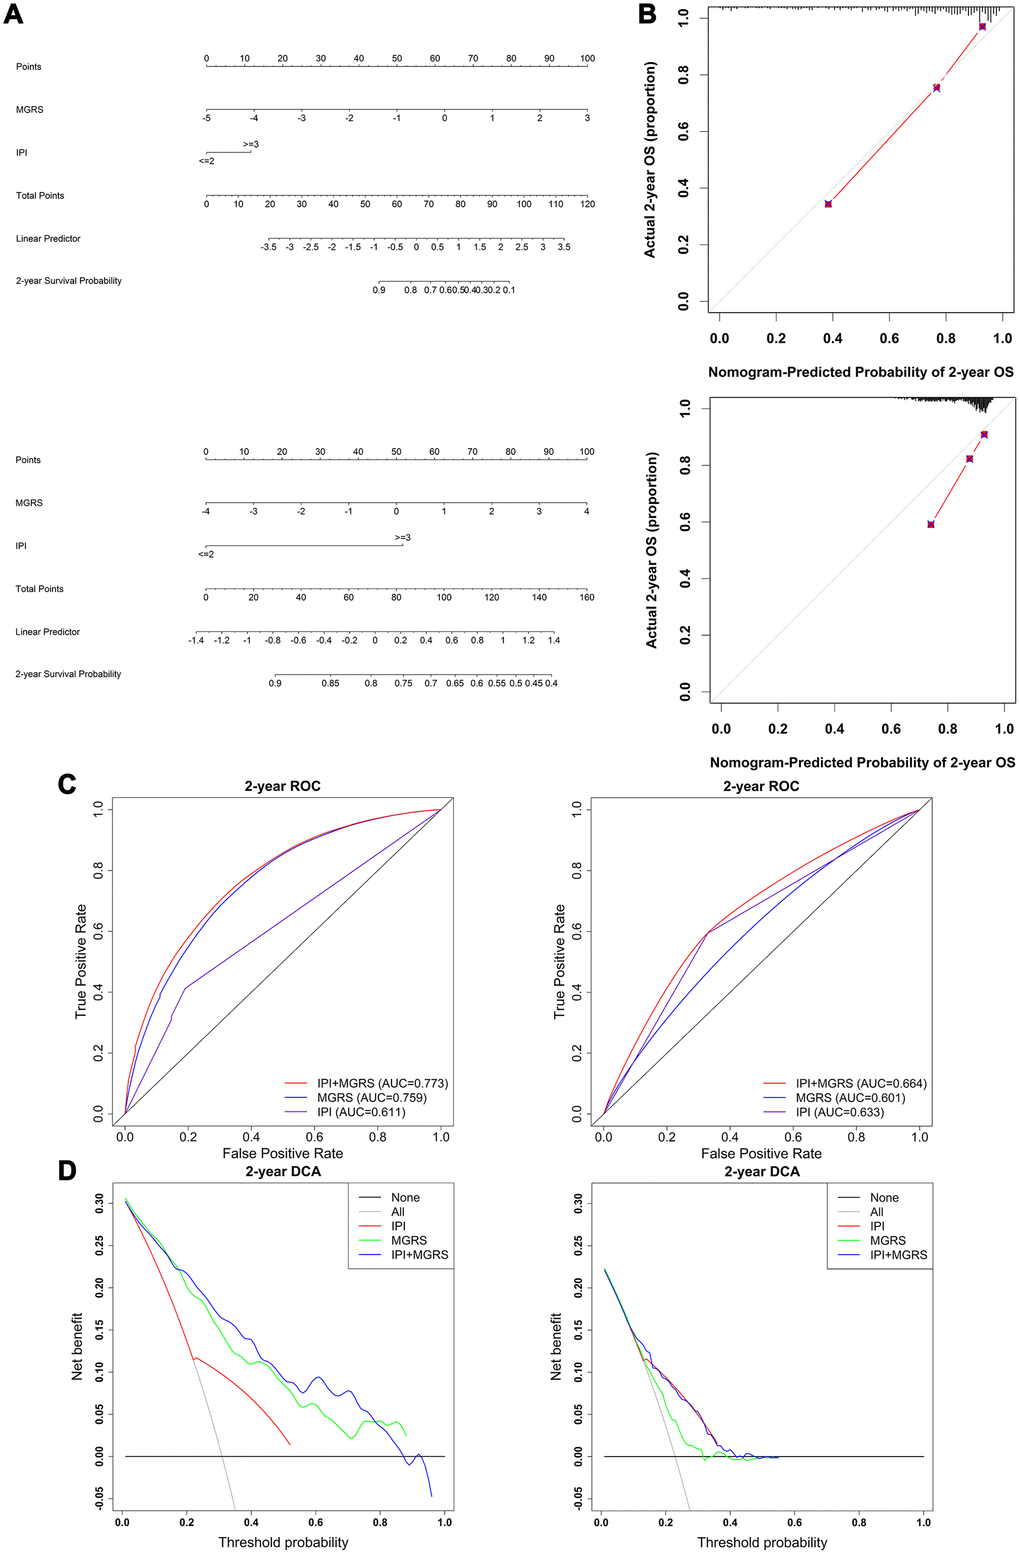
Figure 5.Evaluation and comparison of model performances in predicting 2-year survival. (A) Nomogram based on the International Prognostic Index (IPI) and multigene risk score (MGRS) with the training dataset (top panel) and validation dataset (bottom panel); (B) Calibration plot of the nomogram for estimation of survival rates at 2 years after diagnosis in the training dataset (top panel) and validation dataset (bottom panel); (C) Time-dependent ROC curves at 2 years after diagnosis for the IPI, MGRS, and IPI+MGRS models in the training dataset (left panel) and validation dataset (right panel); (D) Decision curves at 2 years after diagnosis for the IPI, MGRS, and IPI+MGRS models, in the training dataset (left panel) and validation dataset (right panel).