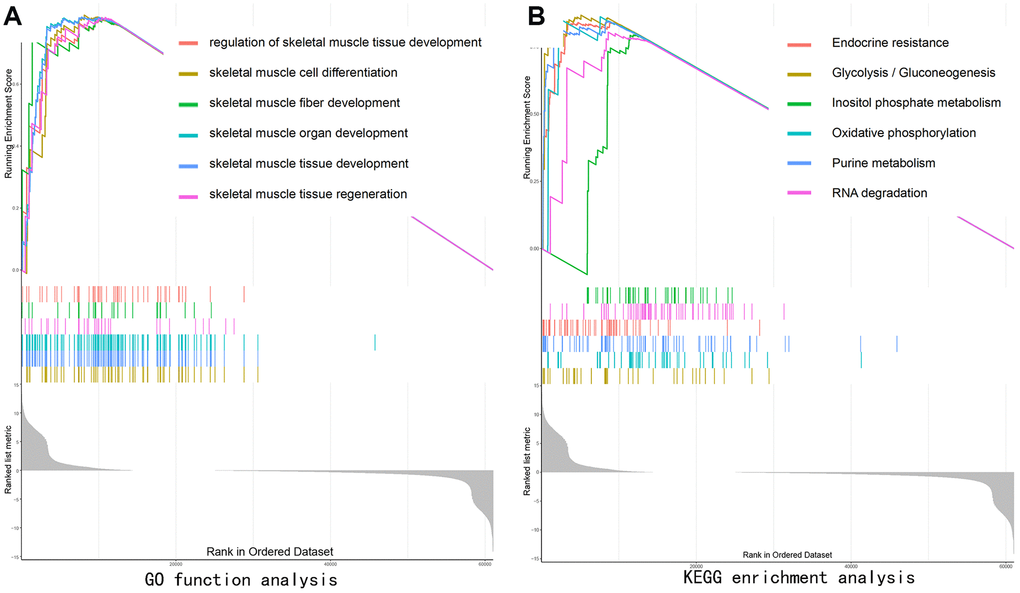
Figure 7.Gene set enrichment analysis (GSEA) showing the biological pathways and processes associated with SEPP1. Significant correlations between the high and low SEPP1 expression groups. (A) GO enrichment analysis; (B) KEGG enrichment analysis.
Figure 7 — lncRNA DLEU2 acts as a miR-181a sponge to regulate SEPP1 and inhibit skeletal muscle differentiation and regeneration | Aging