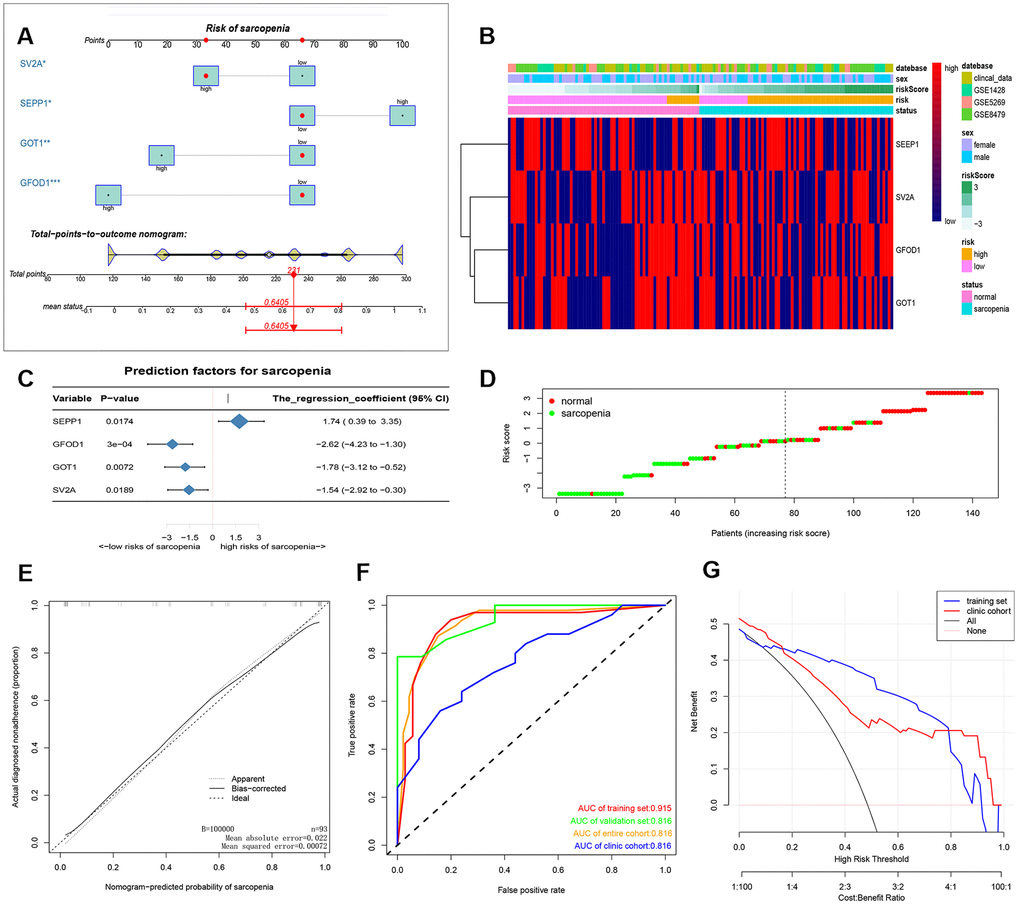
Figure 2.(A) prediction nomogram of sarcopenia. Note: expression level of 4 DE-miRNAs, SEPP1, SV2A, GOT1 and GFOD1 are included. (B) Heatmap plots of DEMs (SEPP1, SV2A, GOT1 and GFOD1) in clinical samples and GSE8479, GSE1428, and GSE52699 datasets. (C) A forest chart showing the prediction factors of sarcopenia. (D) Analysis risk scores of sarcopenia based on DEMs in clinical samples and GSE8479, GSE1428, and GSE52699 datasets. (E) A calibration curve for the predictive model of sarcopenia. Note: The x-axis is the risk of skeletal muscle reduction whereas the y-axis represents the actual incidence of sarcopenia. Diagonal dashed lines represent perfect predictions for an ideal model. The solid line indicates the prediction ability of the proposed prediction model. The closer the solid line matches the dotted line, the higher the prediction ability. (F) The AUC of the nomogram for sarcopenia is equal to the accuracy of randomly selected samples. (G) Decision curve showing the benefit probability of the intervention. The figure shows the decision curve for the training set, validation set, the entire cohort and the clinic cohort.