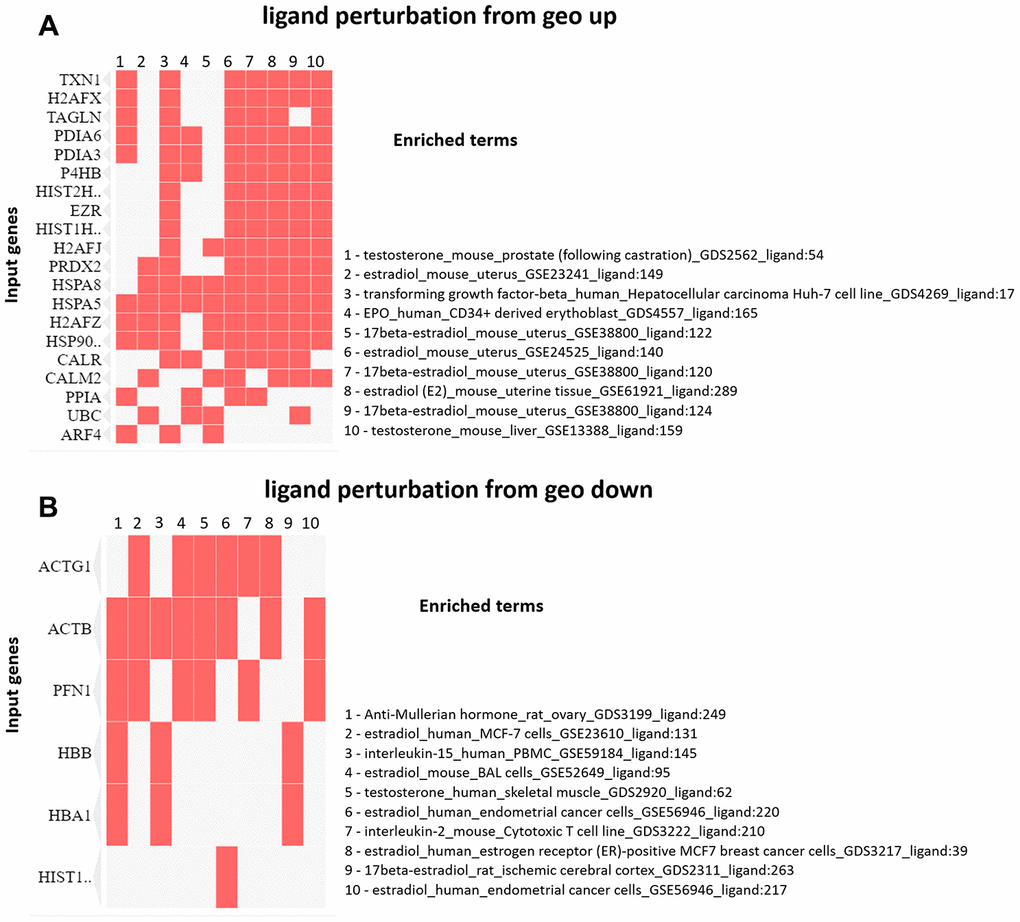
Figure 6.(A) Clustergram generated by Enrichr using upregulated proteins on PND 21. The red cells in the matrix indicate the genes associated with each term. It was demonstrated the top 10 enriched terms with p-value <0.05. (B) Clustergram generated by Enrichr using downregulated proteins on PND 21. The red cells in the matrix indicate the genes associated with each term. It was demonstrated the enriched terms with p-value <0.05 (top 10).