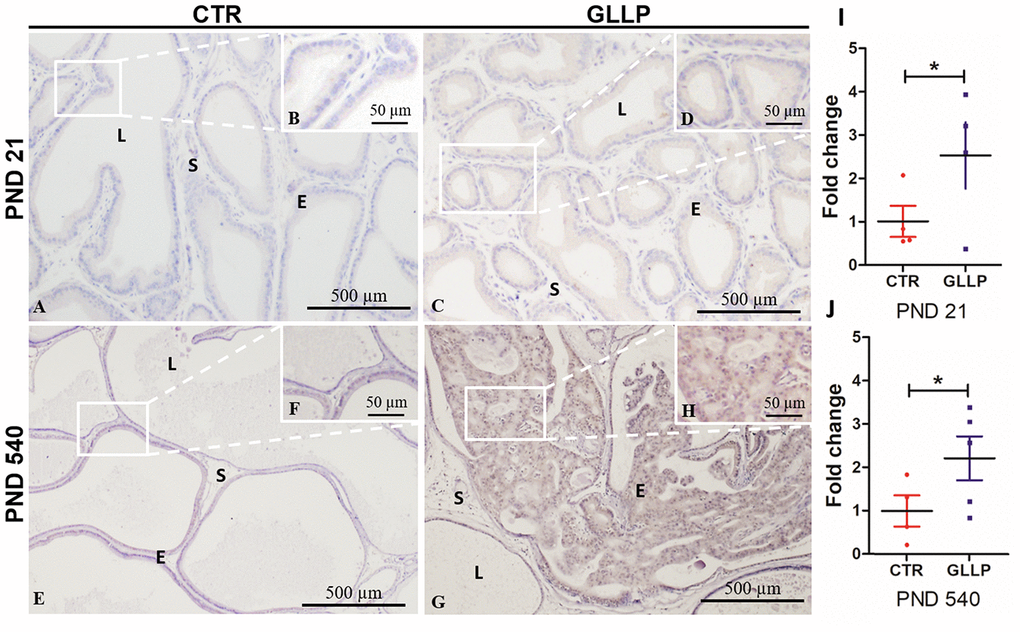
Figure 10.Representative immunohistochemistry reaction for Calreticulin (CALR) in the VP lobes from the CTR and GLLP groups on PND 21 (A–D) and 540 (E–H). RT-qPCR reaction for CALR in the VP lobes from CTR and GLLP groups on PND 21 (I) and 540 (J). CTR = control; GLLP = gestational and lactational low protein; PND = postnatal day. Data are expressed as fold change {plus minus} SD. Asterisks (*) means the statistical difference between experimental groups with p < .05. Scale bar: 500 μm, and detail 50 μm.