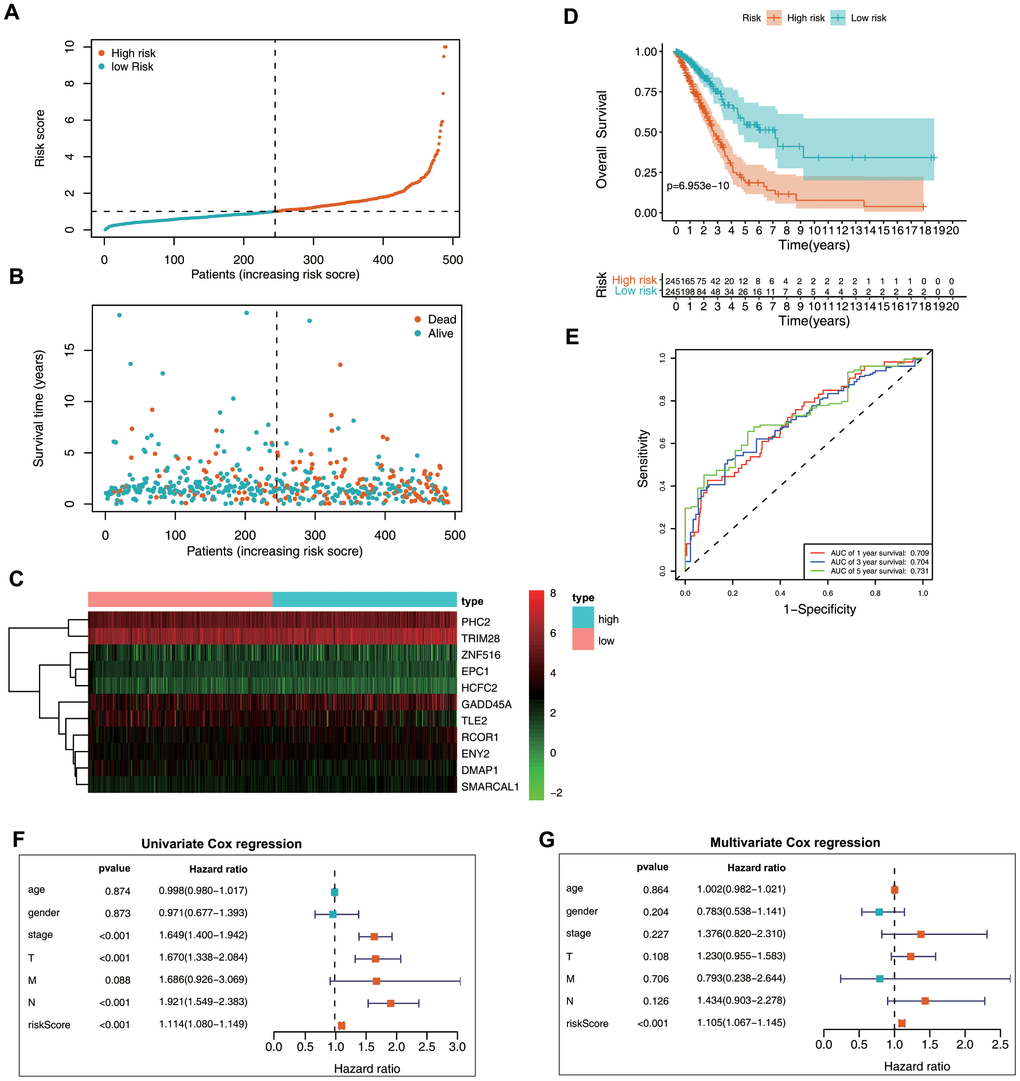
Figure 4.Prognostic value of the epigenetic signature using the training set. (A) Rankings for the risk signature and group distribution. (B) Survival status of patients in the low- and high-risk groups. (C) Heatmap of the gene-expression profiles. (D) Patients in the high-risk group demonstrated poor OS. (E) ROC curve showing the prognostic significance of the risk signature. (F) Univariate and (G) multivariate Cox regression analyses of discrete clinical factors.