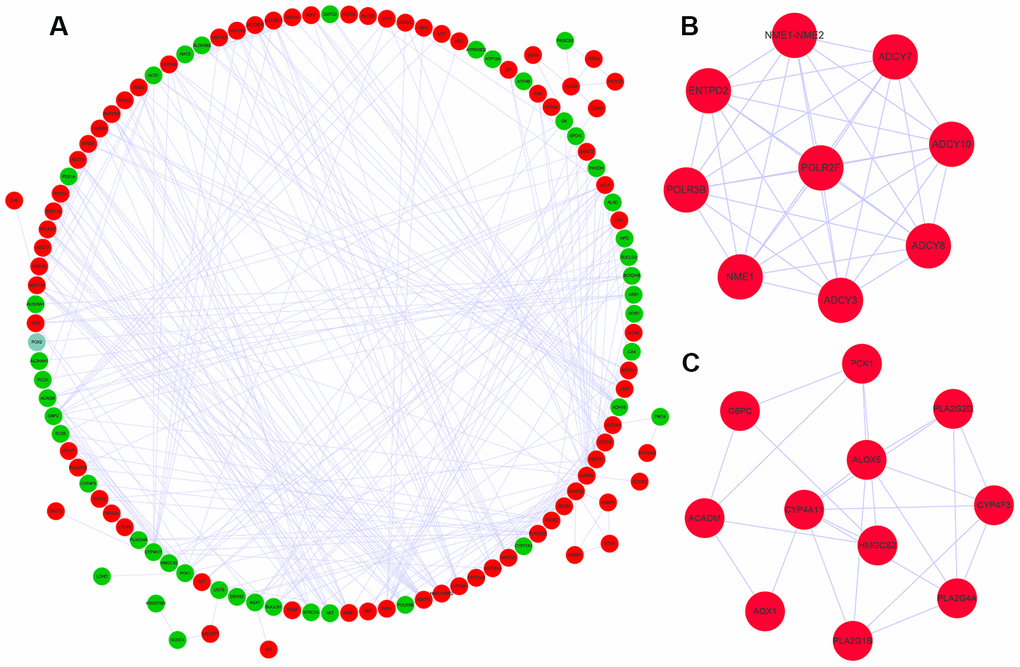
Figure 3.Protein-protein interaction network and key co-expression modules. (A) The protein-protein interaction (PPI) network shows the interactions between 124 differentially expressed metabolic genes. (B, C) The two key modules consisting of co-expressing differentially expressed metabolic genes, module 1 and module 2 are shown. The red and green circles denote upregulated and downregulated metabolic genes, respectively.