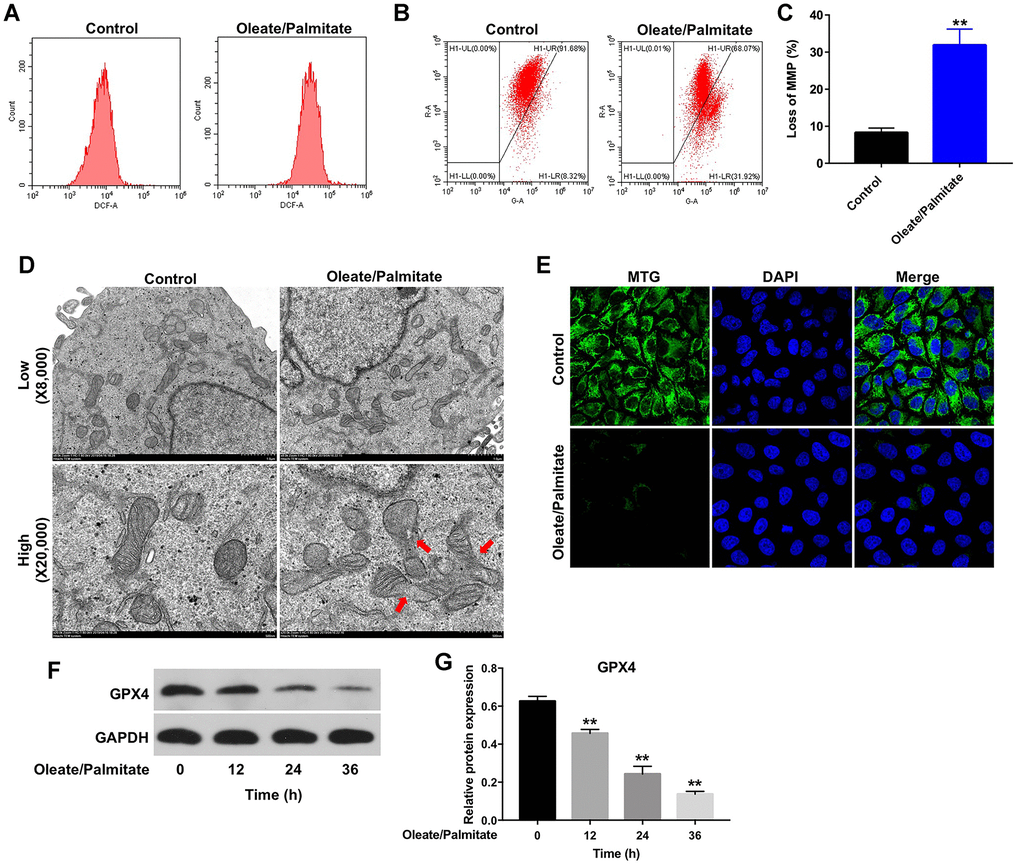
Figure 2.Oleate/palmitate induces ROS generation and decreases MMP in HepG2 cells. HepG2 cells were incubated with oleate/palmitate (2:1 molar ratio) for 24 h. (A) ROS generation was detected as DCF fluorescence using flow cytometry. (B, C) JC-1 staining was used to detect mitochondrial membrane depolarization. (D) Changes in mitochondrial morphology were observed in HepG2 cells using TEM. The mitochondria from oleate/palmitate-treated HepG2 cells were swollen and cristae appeared disrupted (red arrows). Magnification: 20,000x. (E) Mitochondrial distribution in HepG2 cells detected with MTG staining. The green color represents mitochondria staining. (F) HepG2 cells were incubated with oleate/palmitate (2:1 molar ratio) for 0, 12, 24 and 36 h. Levels of GPX4 expression in HepG2 cells were detected with western blotting. GAPDH was used as an internal control. (G) Relative expression of GPX4 in HepG2 cells was quantified by normalization to β-actin. **P<0.01 vs. control group.