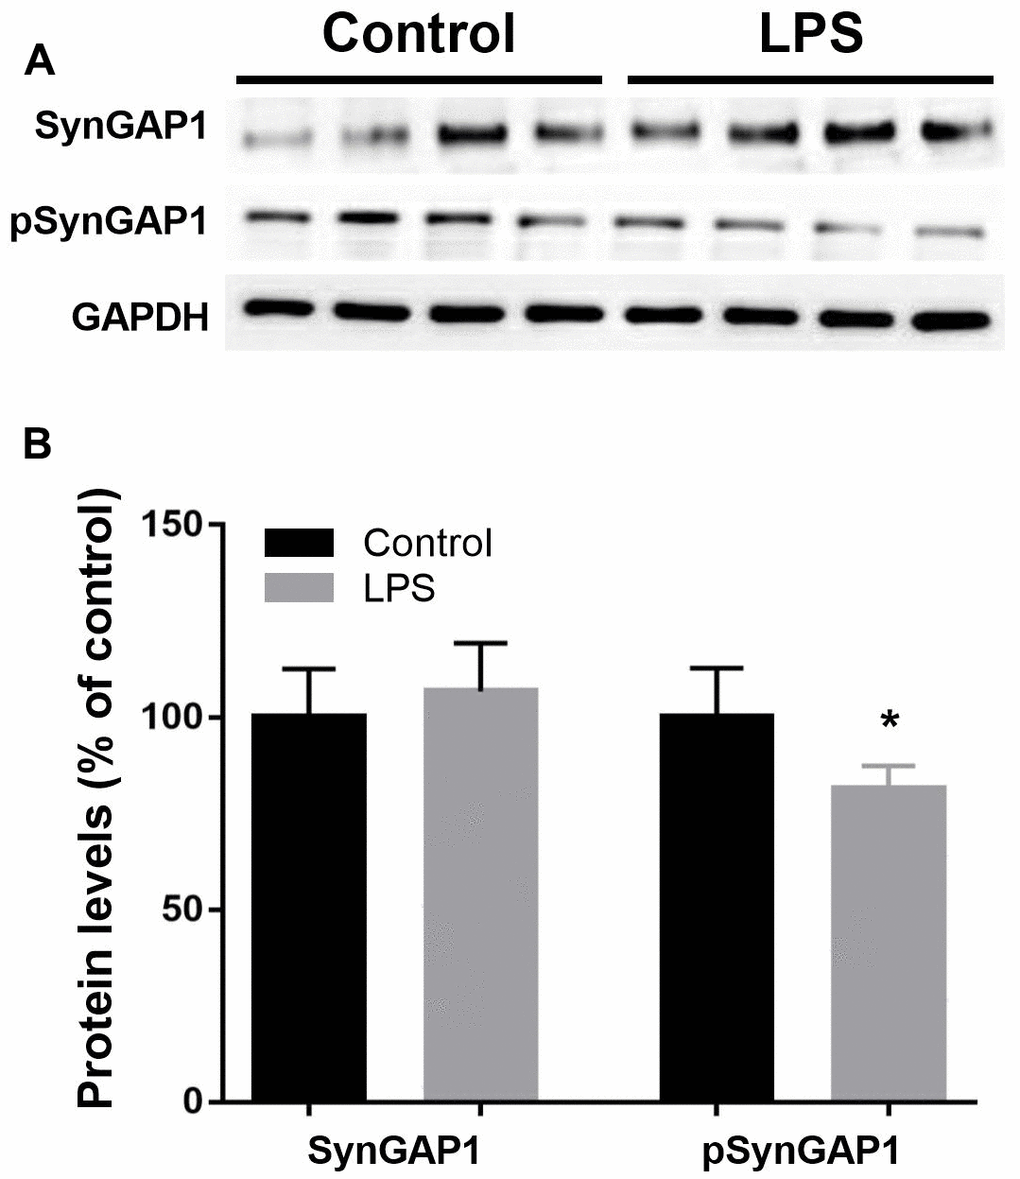
Figure 6.Validation of Syngap1 and pSyngap1 in hippocampus by western blotting analysis. (A) Representative Western blots bands of Syngap1 and pSyngap1 in the hippocampus; (B) Quantitative analysis of Syngap1 and pSyngap1 levels between groups. Data are presented as the mean ± SEM, n = 4, *P < 0.05.