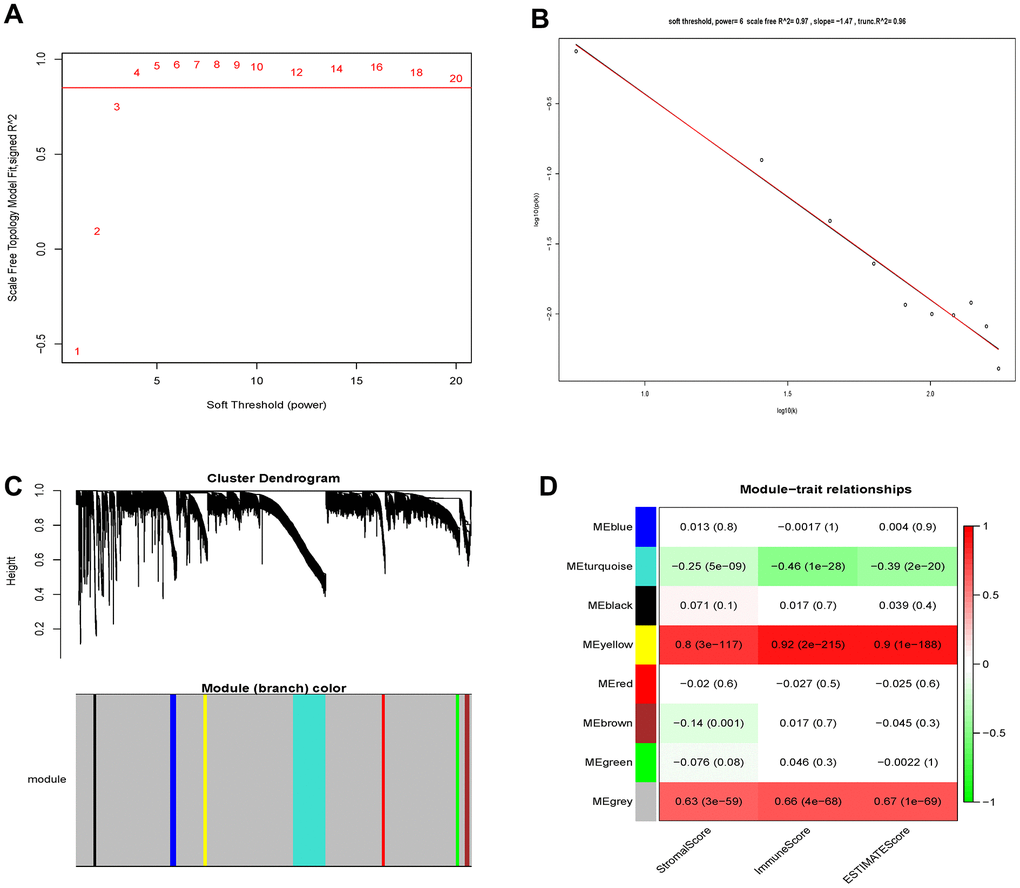
Figure 2.Determination of soft-thresholding power and identification of modules associated with ESTIMATE scores in WGCNA. (A) Analysis of the scale-free fit index for various soft-thresholding powers (β). (B) Checking the scale-free topology when β=6. (C) Dendrogram of all differentially expressed genes clustered based on a dissimilarity measure (1-TOM). (D) Heatmap of the correlation between module eigengenes and clinical traits of Grade II/III glioma cancer.